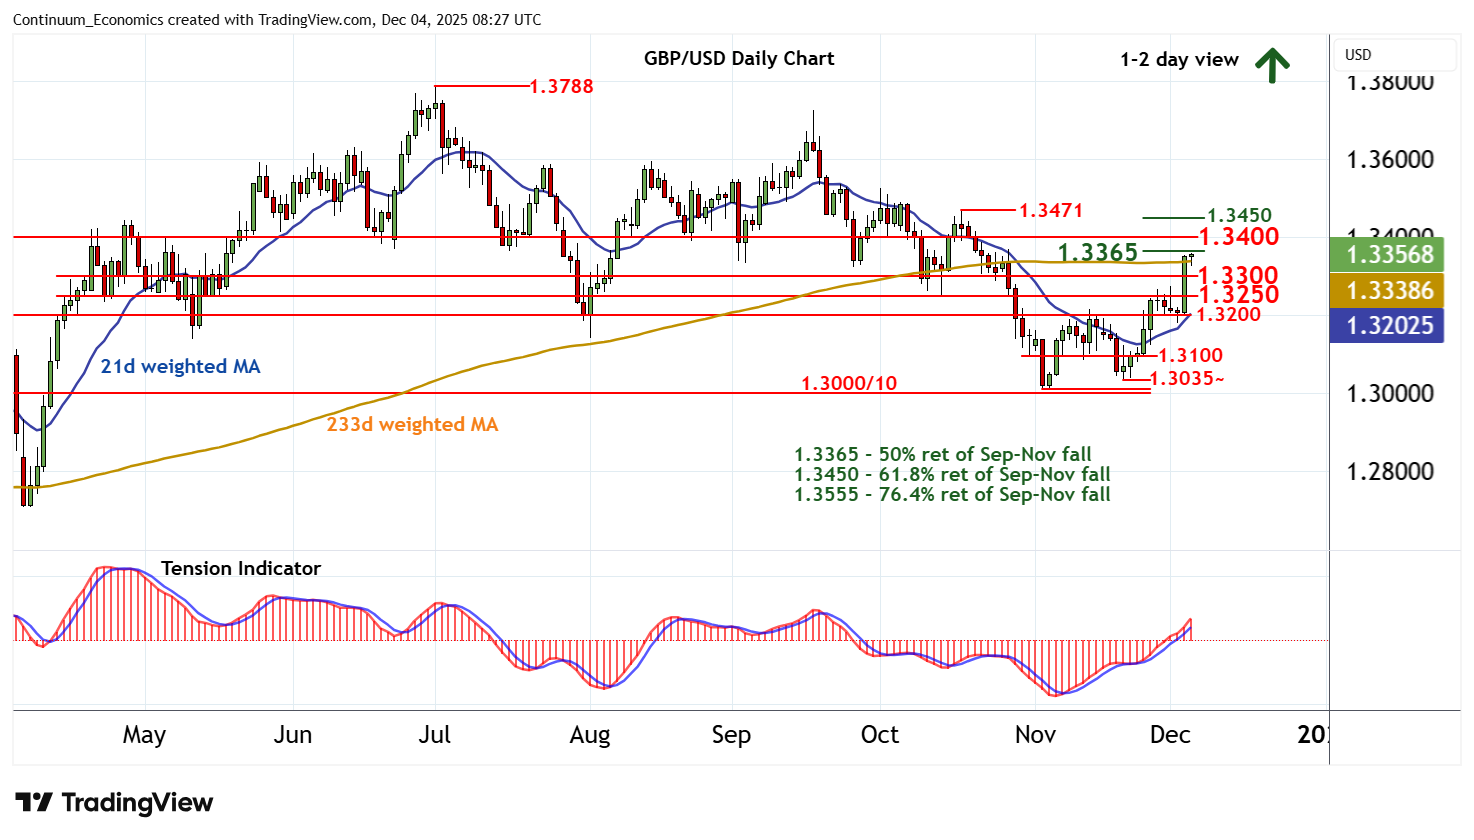
Chart GBP/USD Update: Extending November gains
The anticipated break above 1.3300 has given way to consolidation beneath strong resistance at the 1.3365 Fibonacci retracement
| Level | Comment | Level | Comment | |||||
|---|---|---|---|---|---|---|---|---|
| R4 | 1.3471 | ** | 17 Oct (w) high | S1 | 1.3300 | * | congestion | |
| R3 | 1.3450 | ** | 61.8% ret of Sep-Nov fall | S2 | 1.3250 | * | congestion | |
| R2 | 1.3400 | ** | congestion | S3 | 1.3200 | * | congestion | |
| R1 | 1.3365 | ** | 50% ret of Sep-Nov fall | S4 | 1.3150 | * | congestion |
Asterisk denotes strength of level
08:10 GMT - The anticipated break above 1.3300 has given way to consolidation beneath strong resistance at the 1.3365 Fibonacci retracement, as overbought intraday studies tick lower, with prices currently balanced around 1.3355. Daily readings continue to rise and broader weekly charts are also improving, highlighting a more positive tone and room for still further strength in the coming sessions. A break above 1.3365 will open up congestion around 1.3400. But already overbought daily stochastics are expected to limit any immediate extension beyond here in profit-taking/consolidation beneath the 1.3450 retracement. Meanwhile, support is raised to congestion around 1.3300. An unexpected break beneath here will turn sentiment neutral and prompt consolidation above further congestion around 1.3250.