Published: 2025-04-11T08:40:35.000Z
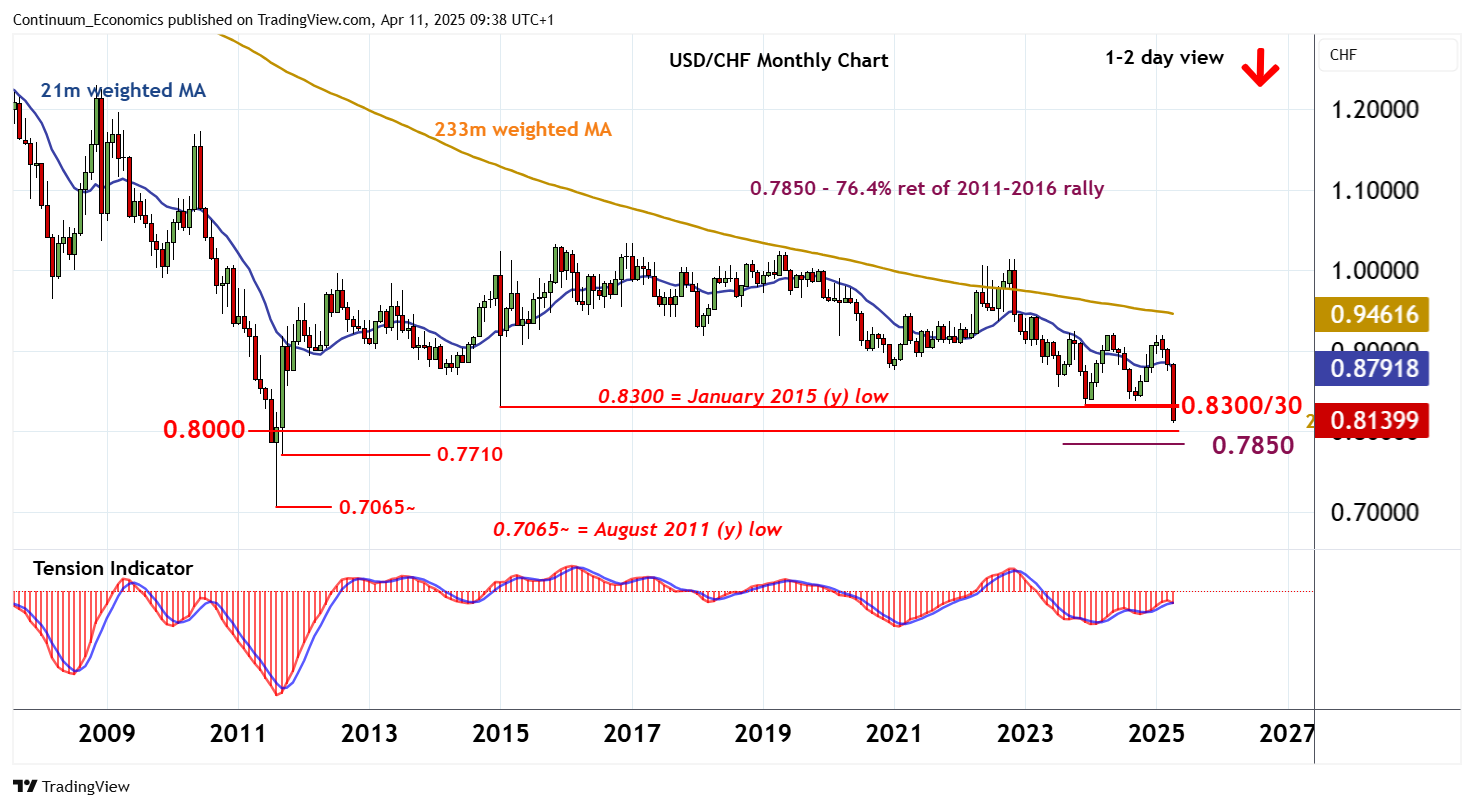
Chart USD/CHF Update: Trading at levels from September 2011

Senior Technical Strategist
-
Prices have extended losses in both USD- and CHF-driven trade
| Level | Comment | Level | Comment | |||||
|---|---|---|---|---|---|---|---|---|
| R4 | 0.8450 | * | congestion | S1 | 0.8000 | ** | figure | |
| R3 | 0.8400 | ** | congestion | S2 | 0.7850 | ** | 76.4% ret of 2011-2016 rally | |
| R2 | 0.8332 | ** | 28 Dec 2023 (y) low | S3 | 0.7710~ | ** | September 2011 (m) low | |
| R1 | 0.8300 | ** | cong, Jan 2015 (y) low | S4 | 0.7500 | ** | figure |
Asterisk denotes strength of level
09:25 BST - Prices have extended losses in both USD- and CHF-driven trade, with the break below 0.8300/30 adding weight to sentiment. Focus is on historic congestion around 0.8000, but negative daily and weekly charts highlight room for still deeper losses. A break beneath here will extend multi-year losses towards the 0.7850 Fibonacci retracement. but already oversold weekly stochastics are expected to limit any initial tests in short-covering/consolidation. Meanwhile, a close back above 0.8300/32 would help to stabilise price action and give way to consolidation.