Published: 2024-12-10T17:08:21.000Z
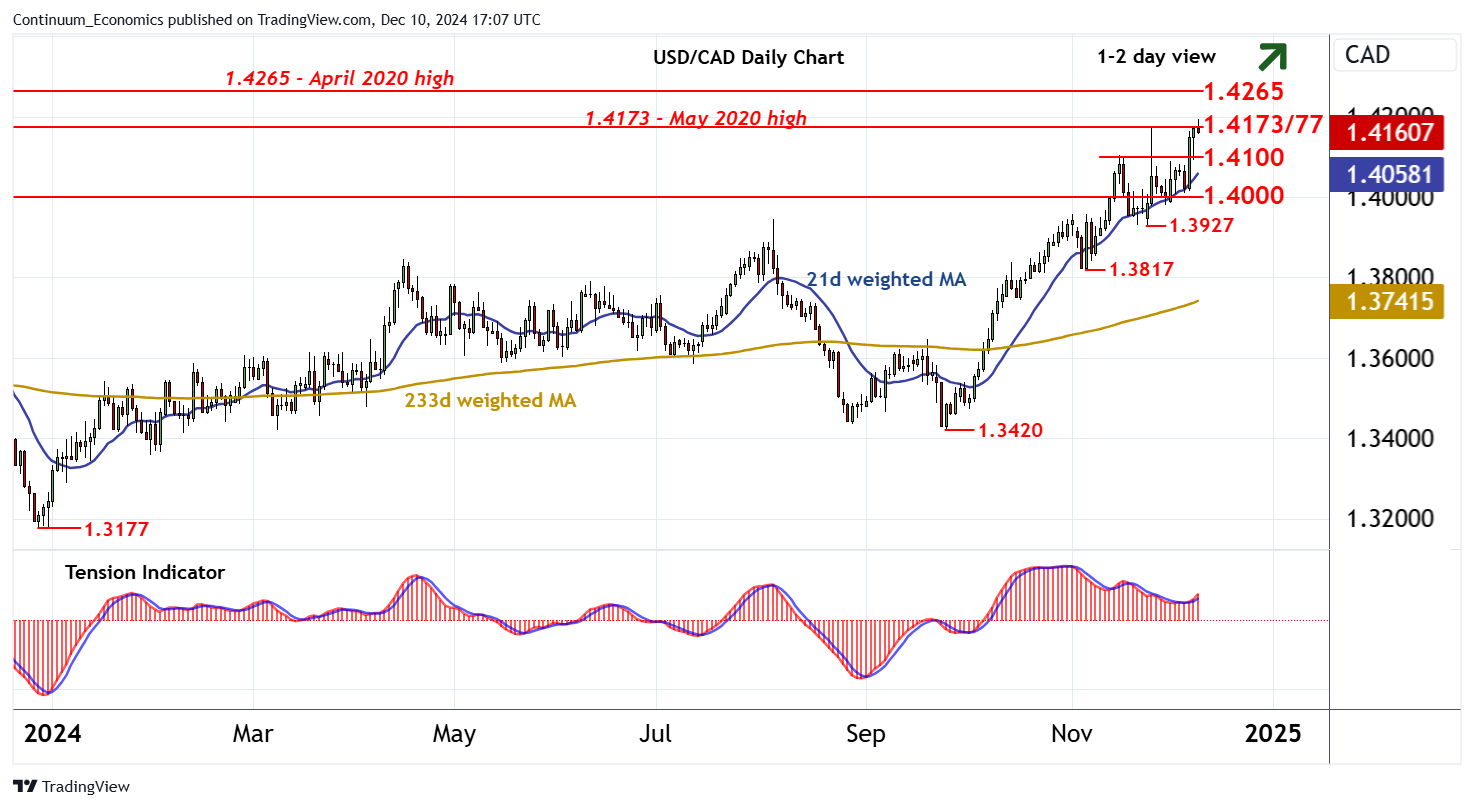
Chart USD/CAD Update: Balanced at year highs - studies improving

Senior Technical Strategist
-

The anticipated test of resistance at the 1.4172/77 area has extended to 1.4195~

| Levels | Imp | Comment | Levels | Imp | Comment | |||
|---|---|---|---|---|---|---|---|---|
| R4 | 1.4298 | ** | April 2020 high | S1 | 1.4100 | * | break level | |
| R3 | 1.4265 | * | late-Apr 2020 (w) high | S2 | 1.4000 | * | congestion | |
| R2 | 1.4200 | historic congestion | S3 | 1.3958 | * | 1-6 Nov (w) high | ||
| R1 | 1.4172/77 | * | May 2020 high; 26 Nov (m) high | S4 | 1.3927 | * | 25 Nov (w) low |
Asterisk denotes strength of level
16:40 GMT - The anticipated test of resistance at the 1.4172/77 area has extended to 1.4195~, where deteriorating intraday studies are prompting selling interest and a break back below 1.4172/77. Daily readings continue to strengthen and broader weekly charts are also improving, suggesting room for a later fresh break and continuation of June 2021 gains beyond 1.4200 towards the 1.4265/68 highs from April 2020. Meanwhile, support remains at 1.4100. A close beneath here, if seen, will turn sentiment neutral and give way to renewed consolidation above congestion support at 1.4000.