Published: 2026-04-27T01:41:39.000Z
Chart EUR/USD Update: Turned up from 200-day MA
-
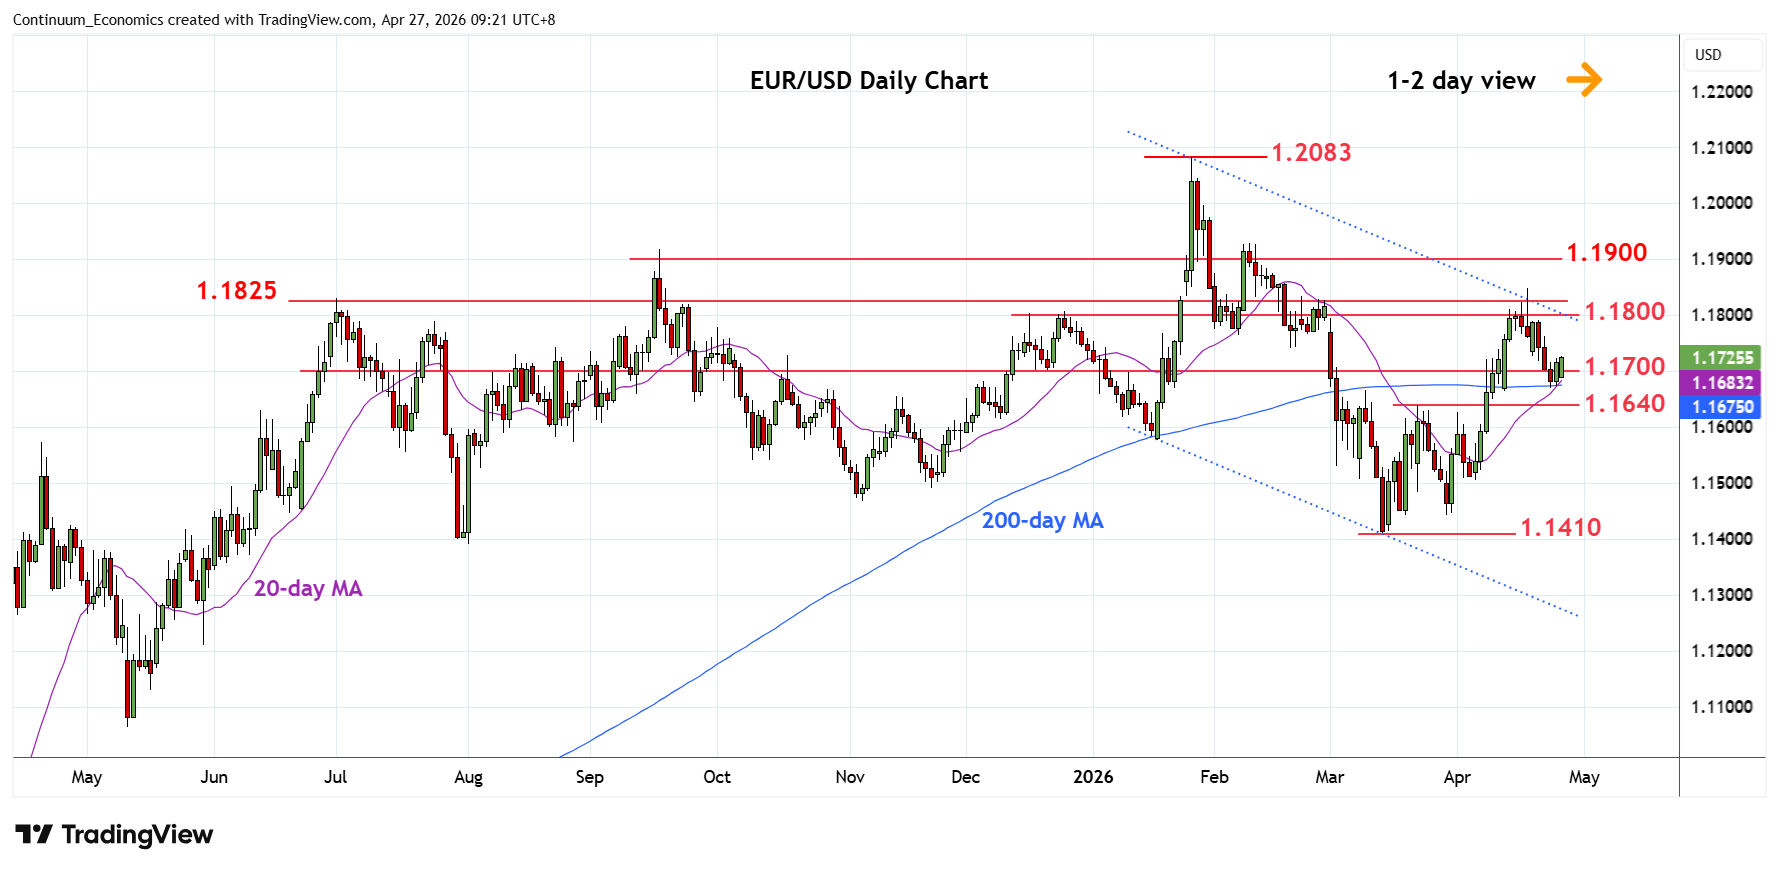
Turned higher from the retest of the 200-day MA at 1.1670 as prices consolidate losses from the 1.1850, 17 April high
| Levels | Imp | Comment | Levels | Imp | Comment | |||
|---|---|---|---|---|---|---|---|---|
| R4 | 1.1850 | * | 17 Apr high, congestion | S1 | 1.1670 | * | 200-day MA | |
| 14 | 1.1825 | * | 61.8% Jan/Mar fall | S2 | 1.1640 | ** | 23 Mar high | |
| R2 | 1.1800 | ** | congestion | S3 | 1.1600 | * | congestion | |
| R1 | 1.1750 | congestion | S4 | 1.1576 | * | Jan low |
Asterisk denotes strength of level
01:30 GMT - Turned higher from the retest of the 200-day MA at 1.1670 as prices consolidate losses from the 1.1850, 17 April high. Resistance is lowered to the 1.1750 congestion and lift over this will open up room for retest of resistance at the 1.1800/25 area. Clearance here will see room to retest the 1.1850 high and further retrace the January/March losses towards strong resistance at the 1.1900/30 area. Meanwhile, support at the 1.1670 low and extending to strong support 23 March high at 1.1640 are expected to underpin.