Published: 2025-08-06T11:29:09.000Z
Chart USD/ZAR Update: Leaning lower

Senior Technical Strategist
-
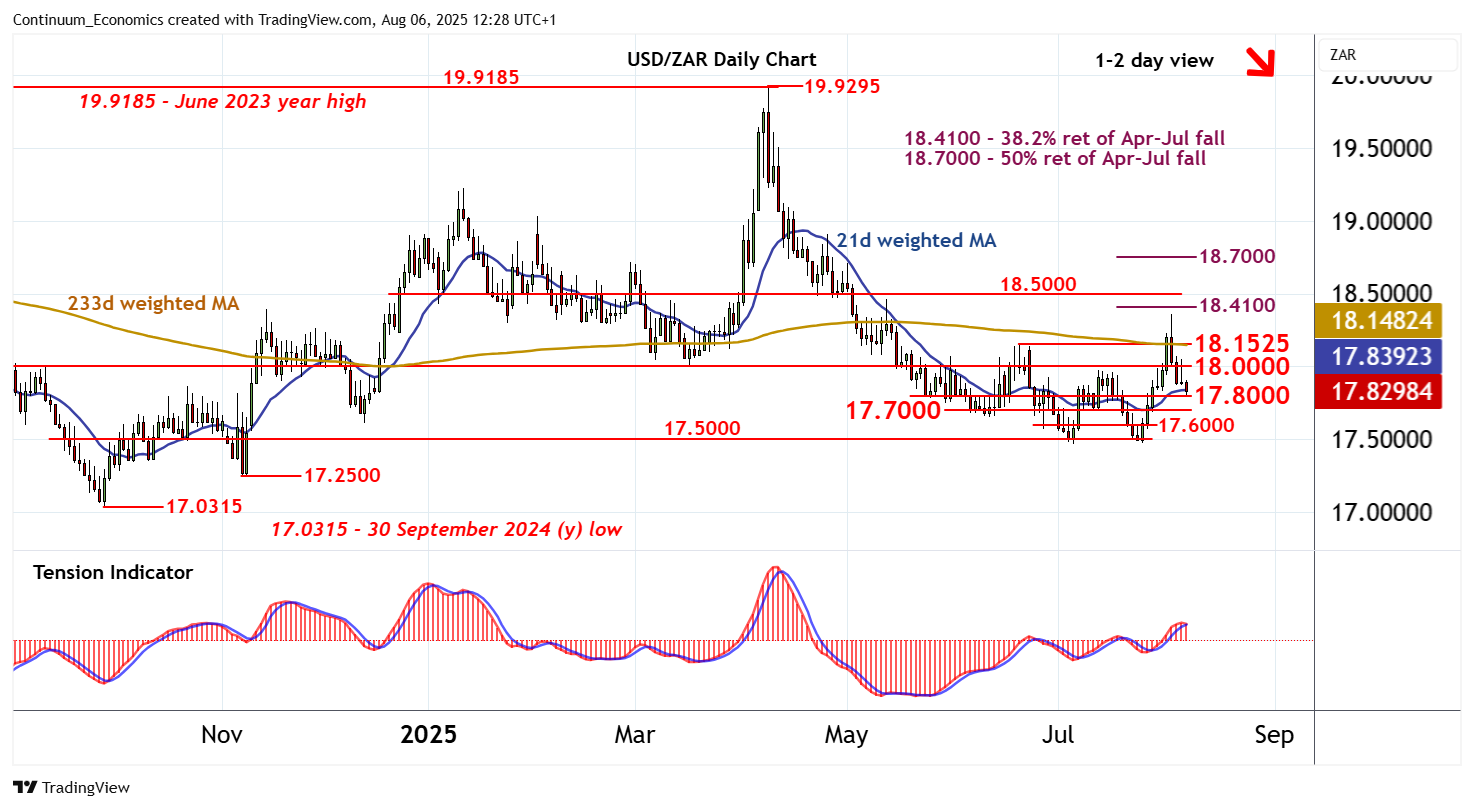
Choppy trade around 18.0000 has given way to the anticipated pullback
| Level | Comment | Level | Comment | |||||
|---|---|---|---|---|---|---|---|---|
| R4 | 18.4100~ | ** | 38.2% ret of Apr-Jul fall | S1 | 17.8000 | * | congestion | |
| R3 | 18.3575~ | * | 1 Aug (w) high | S2 | 17.7000 | * | congestion | |
| R2 | 18.1525 | ** | 19 Jun (m) high | S3 | 17.6000 | * | congestion | |
| R1 | 18.0000 | ** | congestion | S4 | 17.5000 | ** | congestion |
Asterisk denotes strength of level
12:10 BST - Choppy trade around 18.0000 has given way to the anticipated pullback, with prices currently consolidating the test of congestion support at 17.8000. Intraday studies are under pressure and daily readings continue to fall, highlighting room for a break beneath here towards 17.7000. Still lower is 17.6000. But rising weekly charts should limit any tests beneath here in renewed consolidation/buying interest above 17.5000. Meanwhile, resistance is at congestion around 18.0000 and should cap any immediate tests higher.