Published: 2026-03-06T07:14:59.000Z
Chart AUD/JPY Update: Lower within the 112.00/110.00 range
1
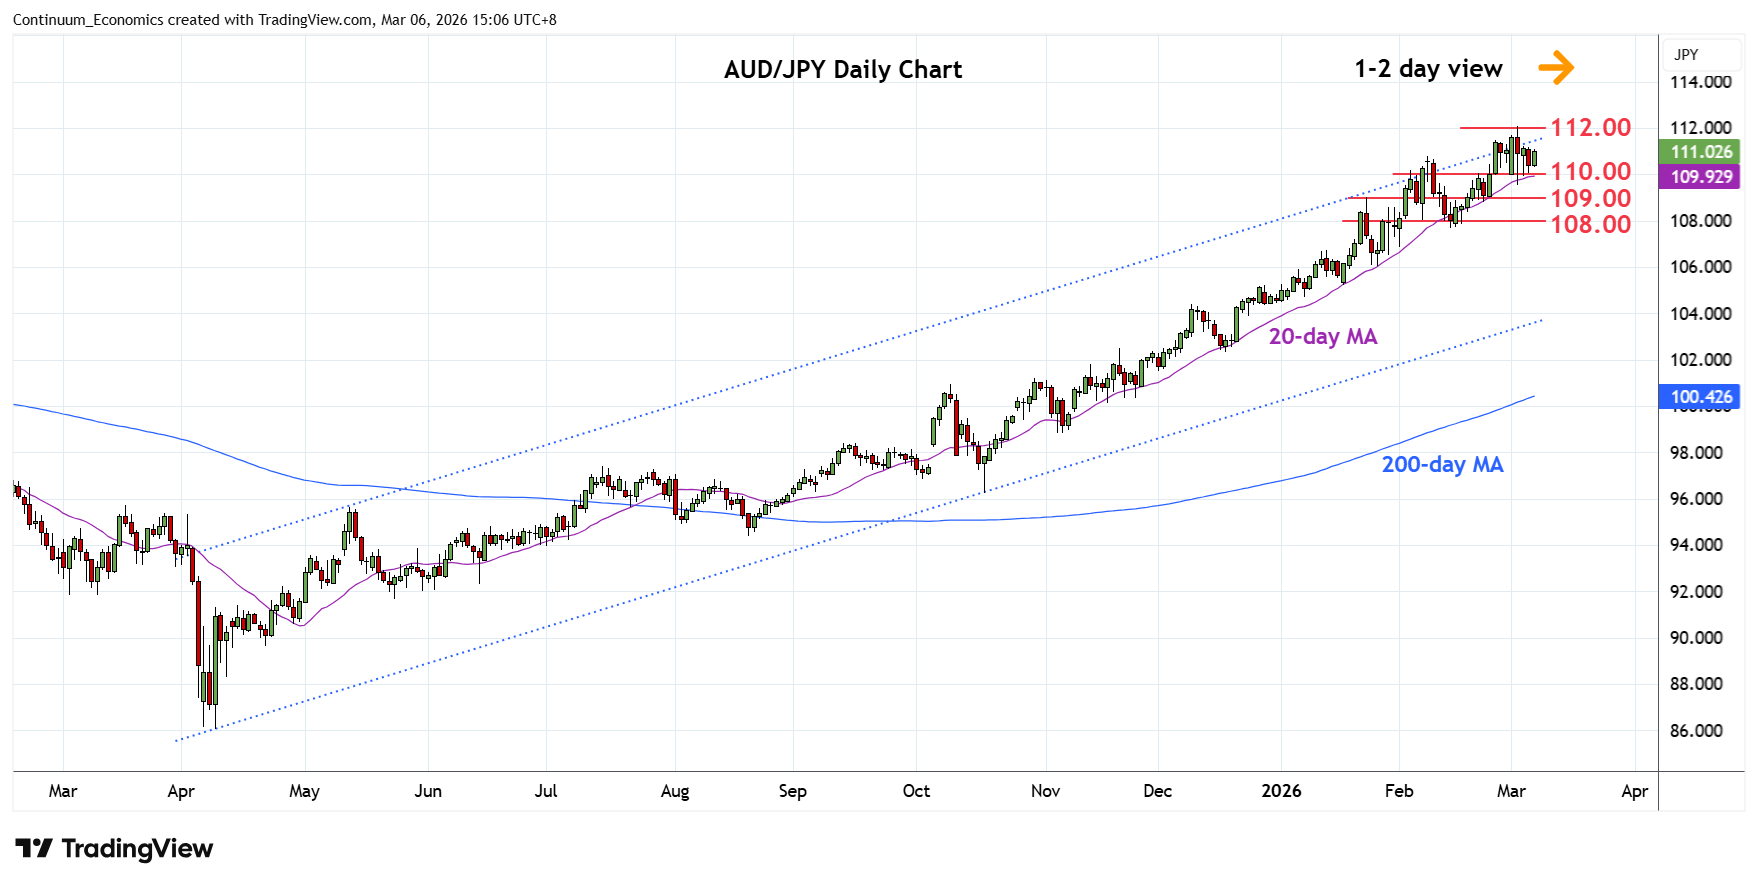
Leaning lower from test of the 112.00 level as prices unwind overbought daily studies
| Levels | Imp | Comment | Levels | Imp | Comment | |||
|---|---|---|---|---|---|---|---|---|
| R4 | 115.00 | * | congestion | S1 | 110.00 | * | congestion | |
| R3 | 114.00 | * | congestion | S2 | 109.00 | ** | congestion, Jan high | |
| R2 | 113.00 | * | congestion | S3 | 107.70 | ** | 13 Feb low | |
| R1 | 112.00/09 | ** | congestion, 3 Mar YTD high | S4 | 106.70 | * | 13 Jan high |
Asterisk denotes strength of level
07:10 GMT - Leaning lower from test of the 112.00 level as prices unwind overbought daily studies. Support starts at the 110.00 congestion and see break here needed to open up room for deeper pullback to correct strong gains from the 86.05, April 2025 year low. Lower will see room to the strong support at the 109.00 congestion and 108.00/107.70 area. Meanwhile, resistance at the 112.00/09 congestion and Tuesday's current year high now expected to cap. Break, if seen, will open up room for extension to the 113.00/114.00 congestion area.