Published: 2026-03-02T13:50:19.000Z
Chart USD/JPY Update: Sharply higher in both USD- and JPY-driven trade
6
Cautious trade has given way to the anticipated break higher
| Levels | Imp | Comment | Levels | Imp | Comment | |||
|---|---|---|---|---|---|---|---|---|
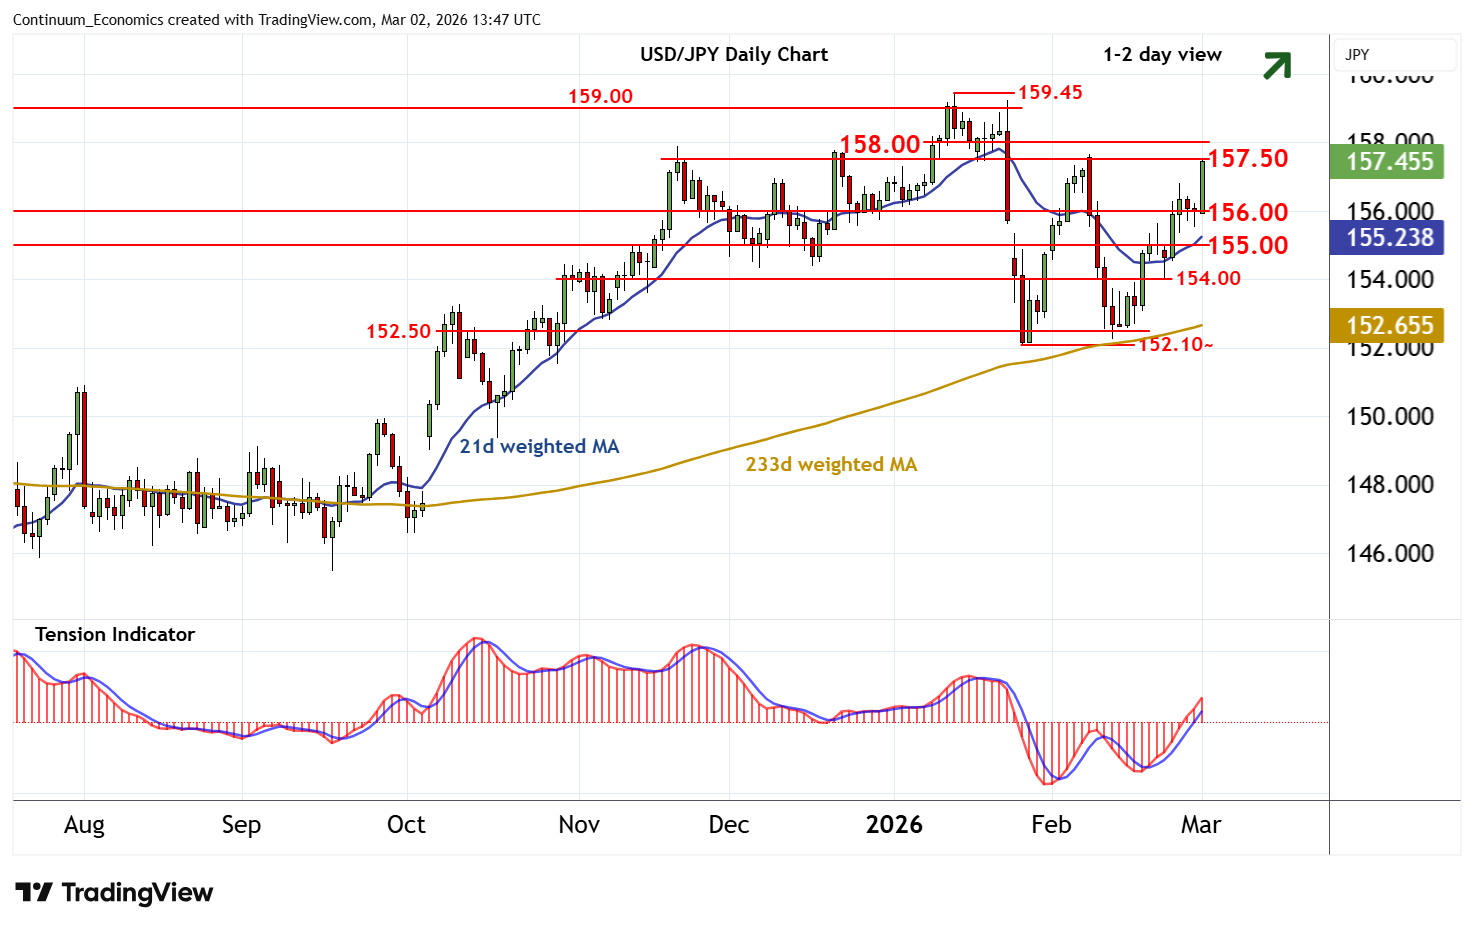
| R4 | 159.45 | ** | 14 Jan YTD high | S1 | 156.00 | * | congestion | |
| R3 | 159.00 | * | congestion | S2 | 155.00 | * | break level | |
| R2 | 158.00 | * | break level | S3 | 154.00 | * | congestion | |
| R1 | 157.50 | * | congestion | S4 | 152.50 | * | congestion |
Asterisk denotes strength of level
13:35 GMT - Cautious trade has given way to the anticipated break higher in both USD- and JPY-driven trade, with prices currently pressuring congestion resistance at 157.50. Daily readings are rising and weekly stochastics are improving, suggesting room for a break above here towards 158.00. However, flat overbought daily stochastics and a bearish weekly Tension Indicator should limit any immediate break in profit-taking/consolidation towards 158.00, before any further gains unfold. Meanwhile, support remains down to congestion around 156.00 and should underpin any immediate setbacks.