Published: 2026-02-04T07:39:17.000Z
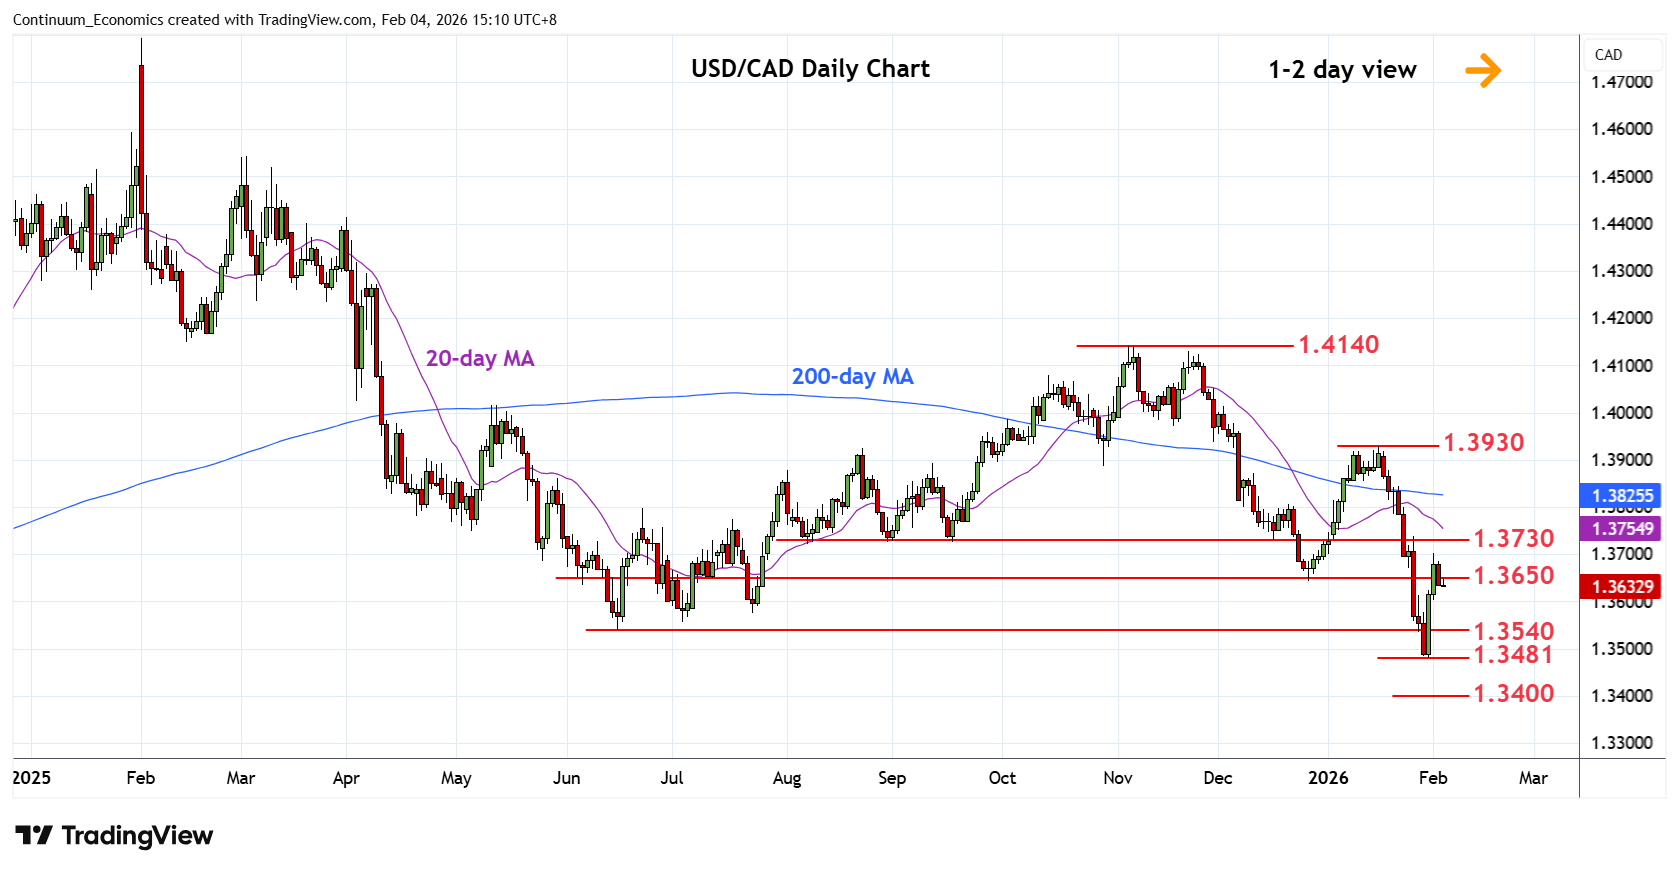
Chart USD/CAD Update: Settling back from test of 1.3700
3
Extend bounce from the 1.3481 low as prices retrace the January losses to reach the 1.3700 level and 50% Fibonacci level
| Levels | Imp | Comment | Levels | Imp | Comment | |||
|---|---|---|---|---|---|---|---|---|
| R4 | 1.3900/30 | ** | congestion, Jan high | S1 | 1.3600 | congestion | ||
| R3 | 1.3800 | * | congestion | S2 | 1.3540 | * | 16 Jun 2025 year low | |
| R2 | 1.3730 | * | Sep low, congestion | S3 | 1.3481 | ** | 30 Jan YTD low | |
| R1 | 1.3700 | * | congestion, 50% | S4 | 1.3420/00 | * | Sep 2024 low, 50% |
Asterisk denotes strength of level
07:35 GMT - Extend bounce from the 1.3481 low as prices retrace the January losses to reach the 1.3700 level and 50% Fibonacci level. Daily studies unwinding oversold readings but resistance at the 1.3700/30 area is expected to cap and give way to renewed selling pressure later. Meanwhile, support is raised to the 1.3600 level and break here will return focus to the downside for retest of the 1.3540 support and 1.3481 low. Below the latter will extend losses from the February 2025 year high and see room to 1.3400, 50% Fibonacci level.