Published: 2026-01-30T01:29:54.000Z
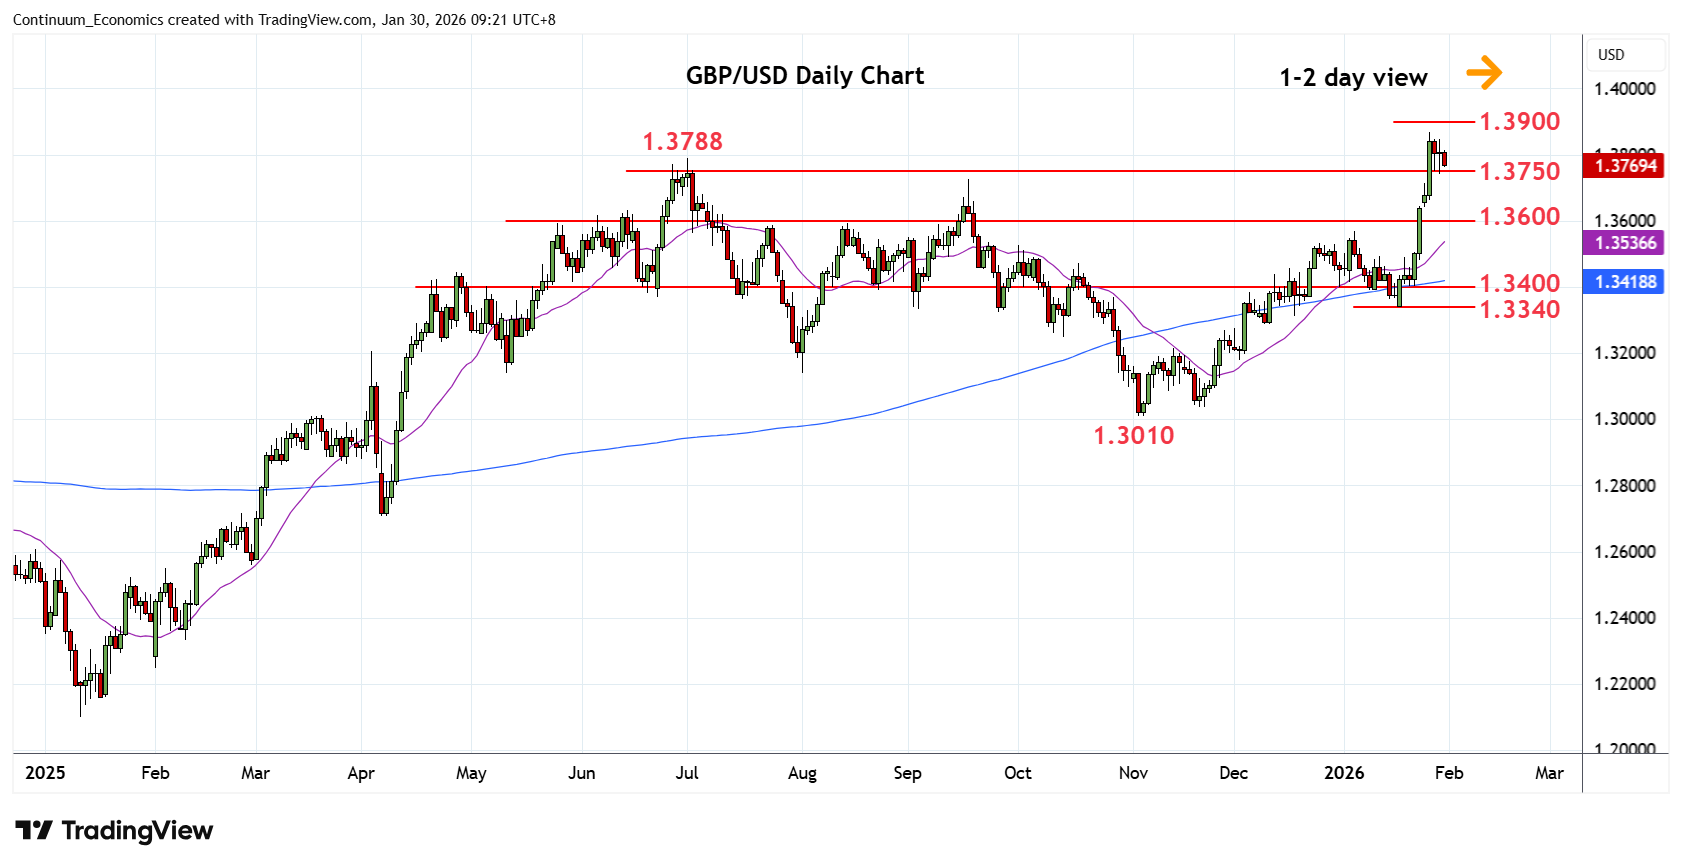
Chart GBP/USD Update: Lower in consolidation from 1.3869 high
-
Lower in range from the Tuesday's 1.3869 high as prices consolidate strong gains from the 1.3340 low of last week
| Level | Comment | Level | Comment | |||||
|---|---|---|---|---|---|---|---|---|
| R4 | 1.4100 | ** | congestion | S1 | 1.3750 | * | congestion | |
| R3 | 1.4000 | ** | congestion | S2 | 1.3700 | * | congestion | |
| R2 | 1.3900/10 | * | congestion, Sep 2021 high | S3 | 1.3645 | * | 23 Jan high | |
| R1 | 1.3869 | ** | 27 Jan YTD high | S4 | 1.3600 | * | congestion |
Asterisk denotes strength of level
01:25 GMT - Lower in range from the Tuesday's 1.3869 high as prices consolidate strong gains from the 1.3340 low of last week. Pullback see prices unwinding overbought intraday and daily studies with support starting at the 1.3750/1.3700 congestion area which is expected to underpin. Break here will open up room for deeper correction to 1.3600/1.3568 support. Correction is expected to give way to renewed buying interest later. Above 1.3869 high will extend the broader gains from 2022 year low and see room for extension to the September 2021 high at 1.3910 then the 1.4000 figure.