Chart USD/ZAR Update: Limited tests lower

The pullback from the 18.3575~ weekly high of 1 August has reached congestion support at 18.0000
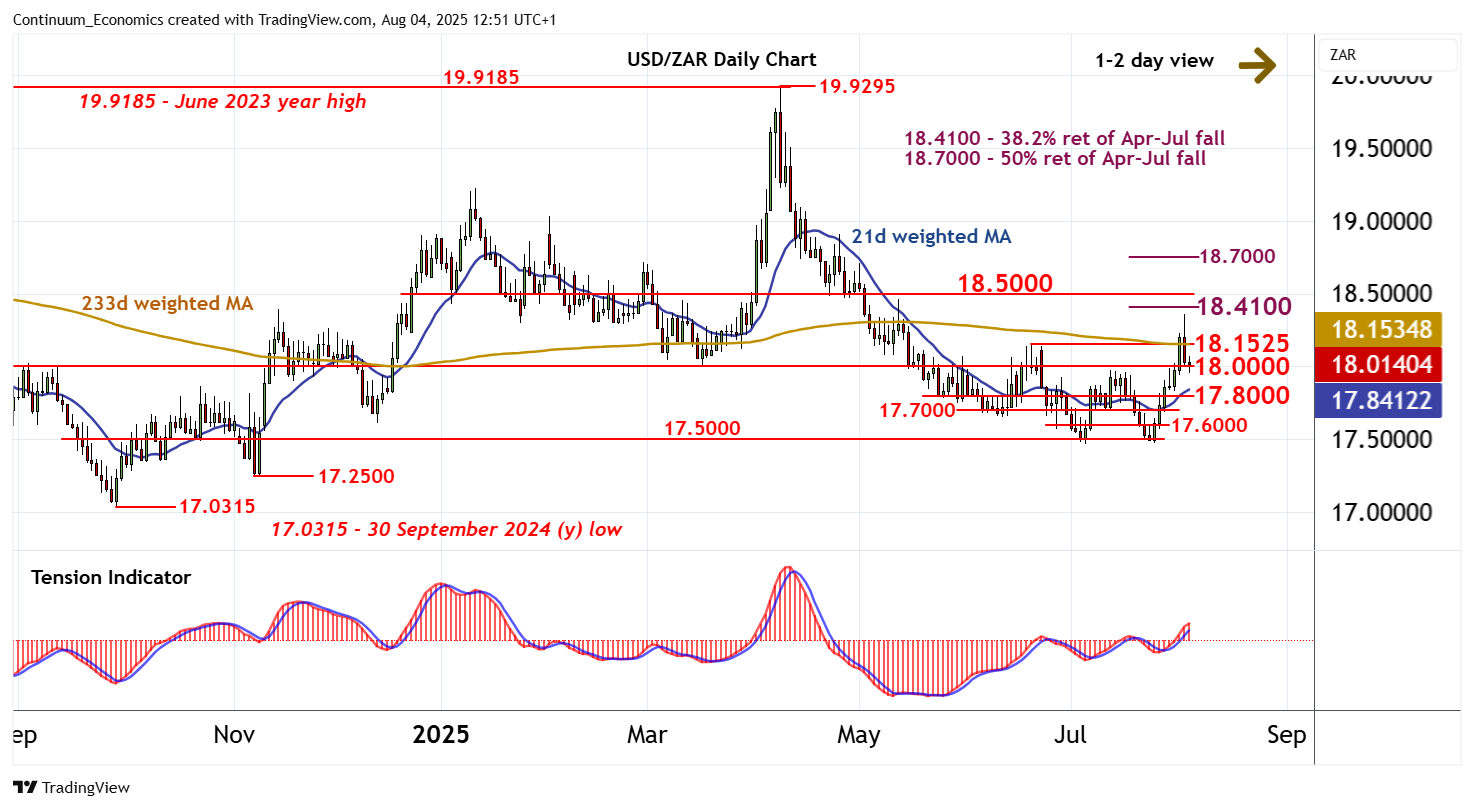
| Level | Comment | Level | Comment | |||||
|---|---|---|---|---|---|---|---|---|
| R4 | 18.5000 | ** | break level | S1 | 18.0000 | ** | congestion | |
| R3 | 18.4100~ | ** | 38.2% ret of Apr-Jul fall | S2 | 17.8000 | * | congestion | |
| R2 | 18.3575~ | * | 1 Aug (w) high | S3 | 17.7000 | * | congestion | |
| R1 | 18.1525 | ** | 19 Jun (m) high | S4 | 17.6000 | * | congestion |
Asterisk denotes strength of level
12:30 BST - The pullback from the 18.3575~ weekly high of 1 August has reached congestion support at 18.0000, where flat oversold intraday studies are prompting consolidation. Dailty readings are also turning down, highlighting room for a test beneath here. But rising weekly charts should limit any break in renewed buying interest/consolidation above further congestion around 17.8000. Meanwhile, resistance is at the 18.1525 monthly high of 19 June. A close back above here would help to improve sentiment. But a further close above the 18.4100 Fibonacci retracement would confirm continuation of July gains, initially to 18.5000, ahead of the 18.7000 retracement.