Published: 2026-01-13T13:04:39.000Z
Chart USD/RUB Update: Consolidating losses - studies under pressure
-
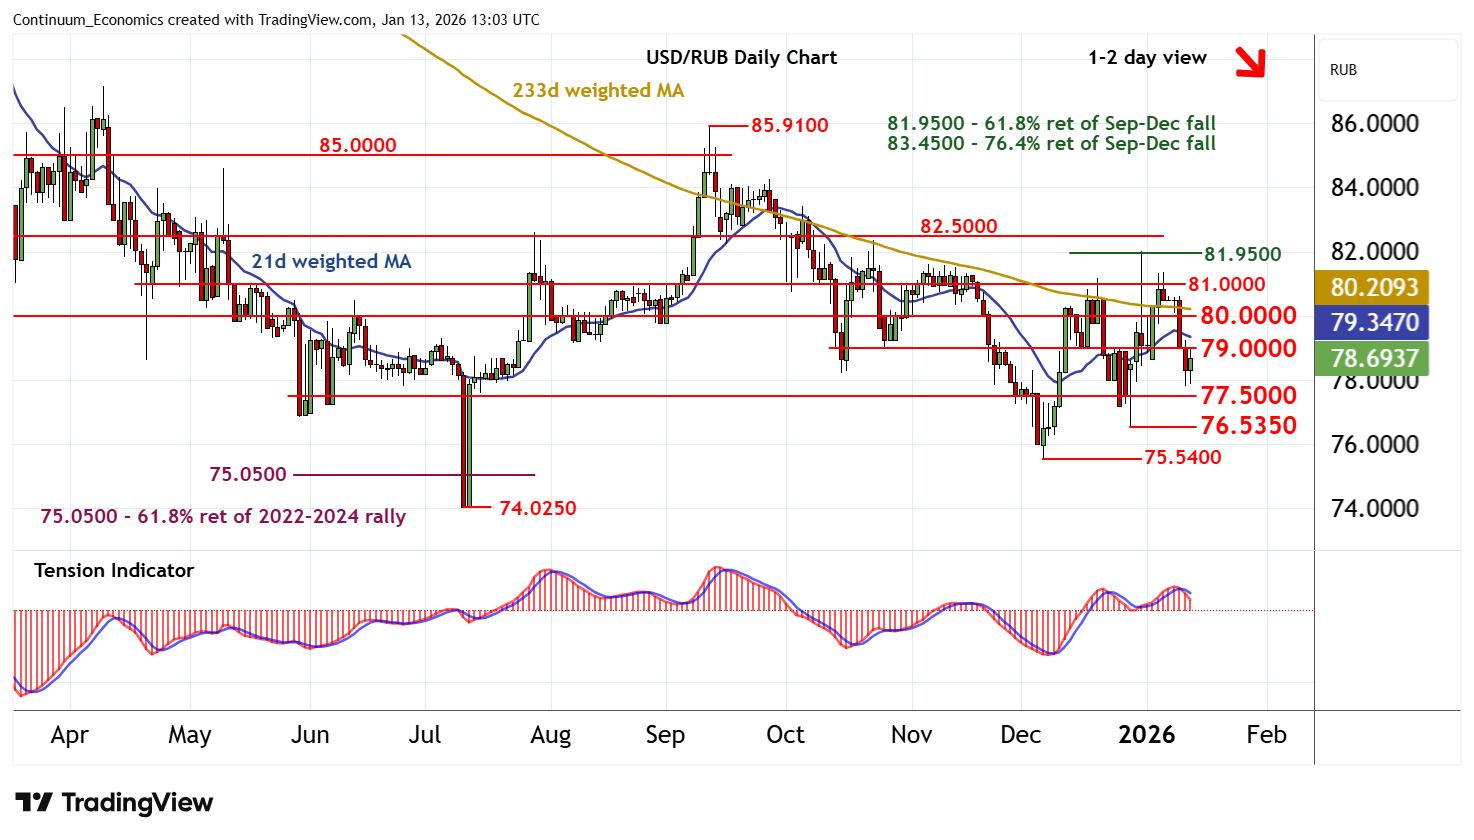
The anticipated break below 79.0000 has bounced from just below 78.0000
| Levels | Comment | Levels | Comment | |||||
| R4 | 81.9500 | ** | 61.8% ret of Sep-Dec fall | S1 | 77.5000 | * | congestion | |
| R3 | 81.0000 | * | congestion | S2 | 76.5350 | * | 29 Dec (w) low | |
| R2 | 80.0000 | ** | congestion | S3 | 75.5400 | ** | 5 Dec (m) low | |
| R1 | 79.0000 | * | break level | S4 | 75.0500 | ** | 61.8% ret of 2022-2024 rally |
Asterisk denotes strength of level
12:30 GMT - The anticipated break below 79.0000 has bounced from just below 78.0000, with prices currently trading around 78.8500. Daily stochastics and the daily Tension Indicator continue to track lower, highlighting room for a test of congestion support at 77.5000. But rising weekly charts should limit any break in renewed buying interest towards the 76.5350 weekly low of 29 December. Meanwhile, resistance is lowered to 79.0000. A close above here, if seen, will help to stabilise price action and prompt consolidation beneath congestion around 80.0000.