Published: 2026-02-19T12:37:41.000Z
Chart USD/ZAR Update: Pushing higher
4
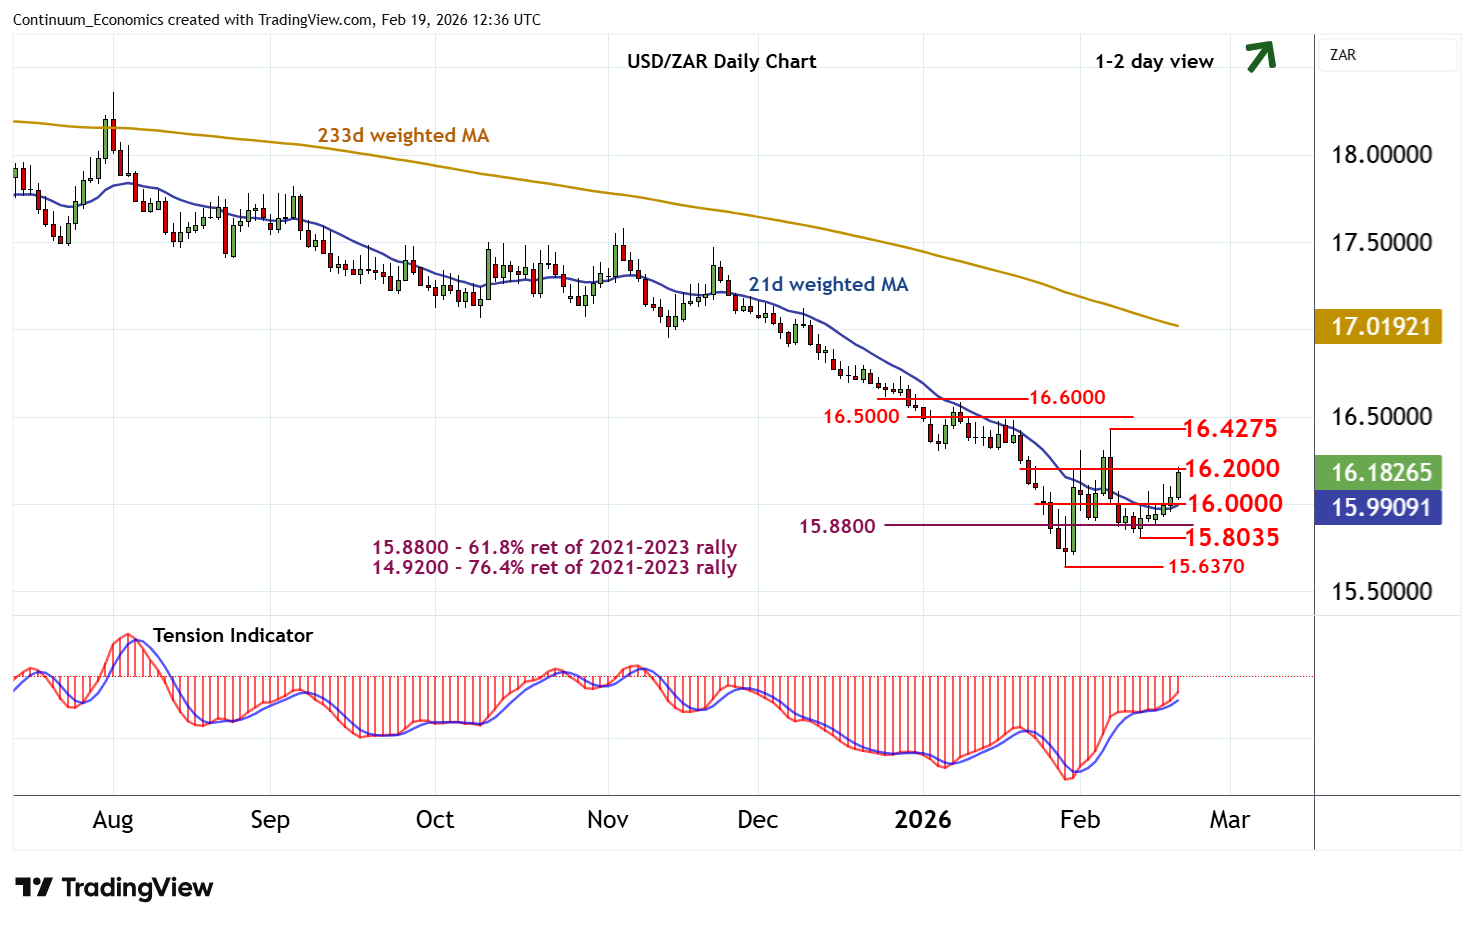
Cautious trade is giving way to anticipated tests higher
| Level | Comment | Level | Comment | |||||
|---|---|---|---|---|---|---|---|---|
| R4 | 16.6000 | break level | S1 | 16.0000 | ** | congestion | ||
| R3 | 16.5000 | break level | S2 | 15.8035 | * | 12 Feb (w) low | ||
| R2 | 16.4275 | * | 6 Feb (w) high | S3 | 15.6370 | ** | 29 Jan YTD low | |
| R1 | 16.2000 | minor congestion | S4 | 15.1665 | * | June 2022 low |
Asterisk denotes strength of level
12:25 GMT - Cautious trade is giving way to anticipated tests higher, as intraday studies improve, with prices currently pressuring congestion resistance at 16.2000. Daily readings are positive and broader weekly charts have turned mixed/positive, suggesting room for further strength in the coming sessions. A break above here will open up the 16.4275 weekly high of 6 February. But already overbought daily stochastics could limit any initial tests in profit-taking/consolidation. Meanwhile, a break below congestion support at 16.0000, if seen, will stabilise price action and prompt consolidation above the 15.8035 weekly low of 12 February.