Published: 2026-04-22T13:38:28.000Z
Chart AUD/USD Update: Consolidating
1
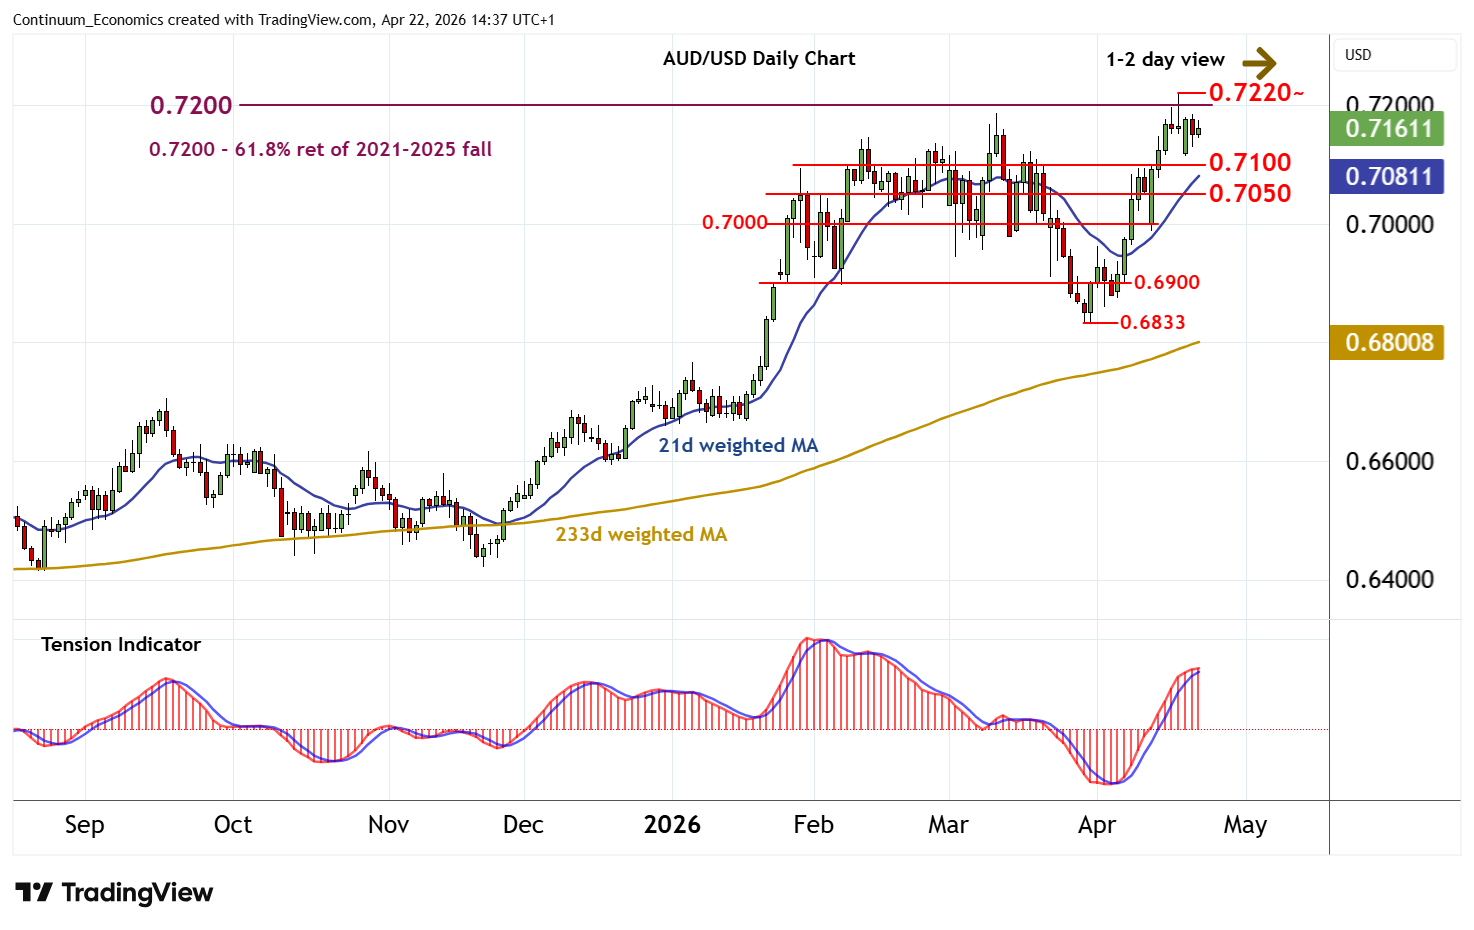
Little change, as prices extend consolidation around 0.7150
| Levels | Imp | Comment | Levels | Imp | Comment | |||
|---|---|---|---|---|---|---|---|---|
| R4 | 0.7400 | ** | historic congestion | S1 | 0.7100 | congestion | ||
| R3 | 0.7280~ | ** | June 2022 high | S2 | 0.7050 | * | congestion | |
| R2 | 0.7220~ | * | 17 Apr YTD high | S3 | 0.7000 | * | congestion | |
| R1 | 0.7200 | ** | 61.8% ret of 2021-2025 fall | S4 | 0.6960 | * | 1 Apr (w) high |
Asterisk denotes strength of level
14:35 BST - Little change, as prices extend consolidation around 0.7150. Overbought daily stochastics are turning down and the positive daily Tension Indicator is flattening, suggesting room for a move lower towards congestion support at 0.7100. But mixed/positive weekly readings should limit any deeper losses in renewed buying interest above further congestion around 0.7050. Meanwhile, strong resistance remains at the 0.7200 Fibonacci retracement and extends to the 0.7220~ current year high of 17 April. A close above here is needed to turn sentiment positive once again and extend April 2025 gains towards the 0.7280~ high of June 2022.