Published: 2025-09-09T08:09:56.000Z
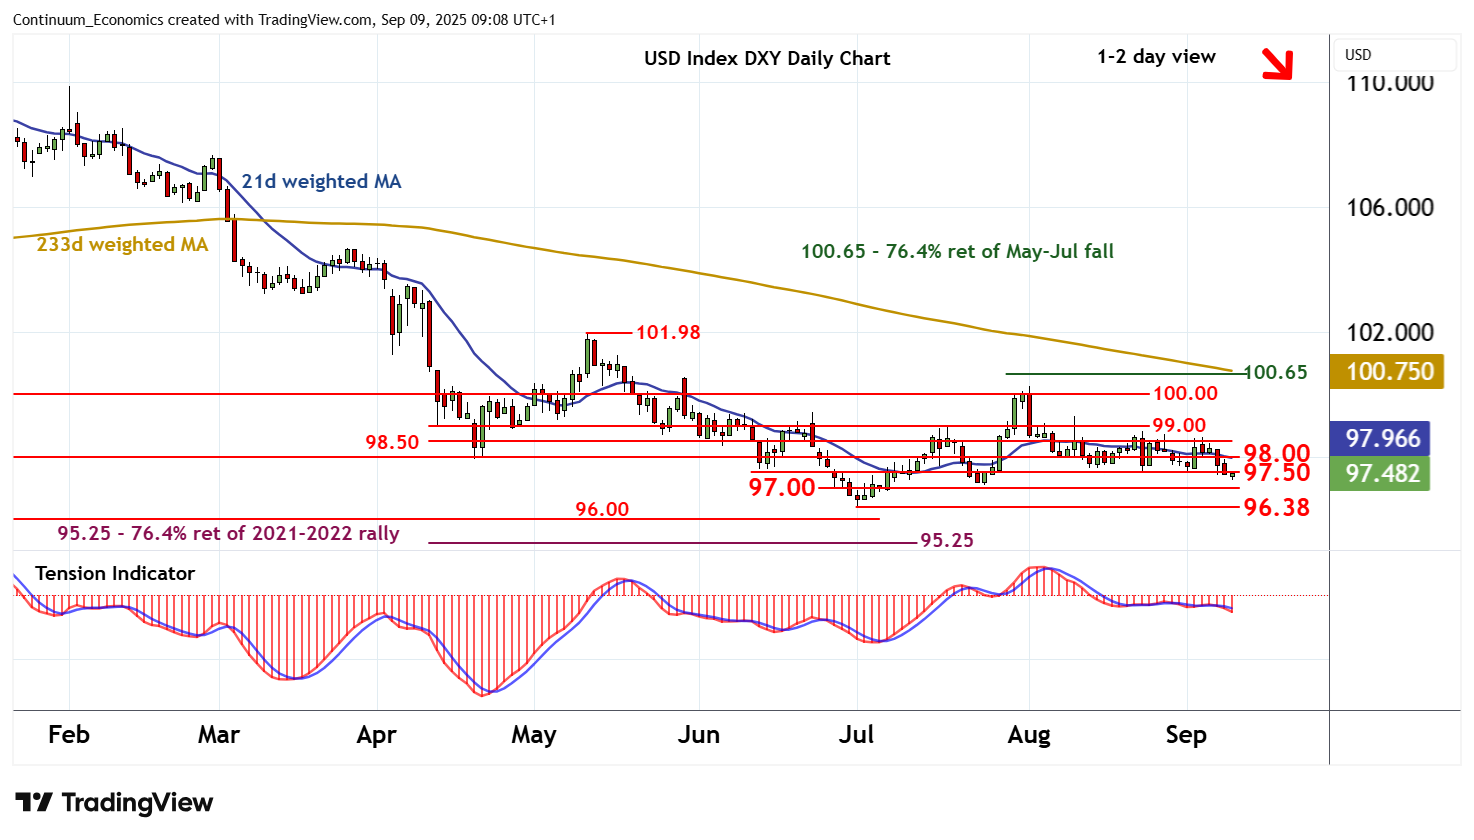
Chart USD Index DXY Update: Extending August losses
0
3
The anticipated break below 97.50 has bounced from 96.25
| Levels | Imp | Comment | Levels | Imp | Comment | |||
|---|---|---|---|---|---|---|---|---|
| R4 | 99.00 | * | break level | S1 | 97.00 | * | congestion | |
| R3 | 98.50 | congestion | S2 | 96.38 | ** | 1 Jul YTD low | ||
| R2 | 98.00 | * | congestion | S3 | 96.00 | * | historic congestion | |
| R1 | 97.50 | * | congestion | S4 | 95.25 | ** | 76.4% ret of 2021-2022 rally |
Asterisk denotes strength of level
09:00 BST - The anticipated break below 97.50 has bounced from 96.25, as oversold intraday studies unwind, with prices currently trading just beneath 97.50. A test above here cannot be ruled out. But negative daily stochastics and the deteriorating daily Tension Indicator are expected to prompt renewed selling interest beneath further congestion around 98.00. In the coming sessions, fresh losses are looked for, with focus to turn to congestion around 97.00. Broader weekly charts are also coming under pressure, highlighting room for still deeper losses towards critical support at the 96.38 current year low of 1 July.