Published: 2025-02-07T07:47:36.000Z
Chart NOK/SEK Update: Consolidating test of .9675, August trendline

Technical Analyst
1
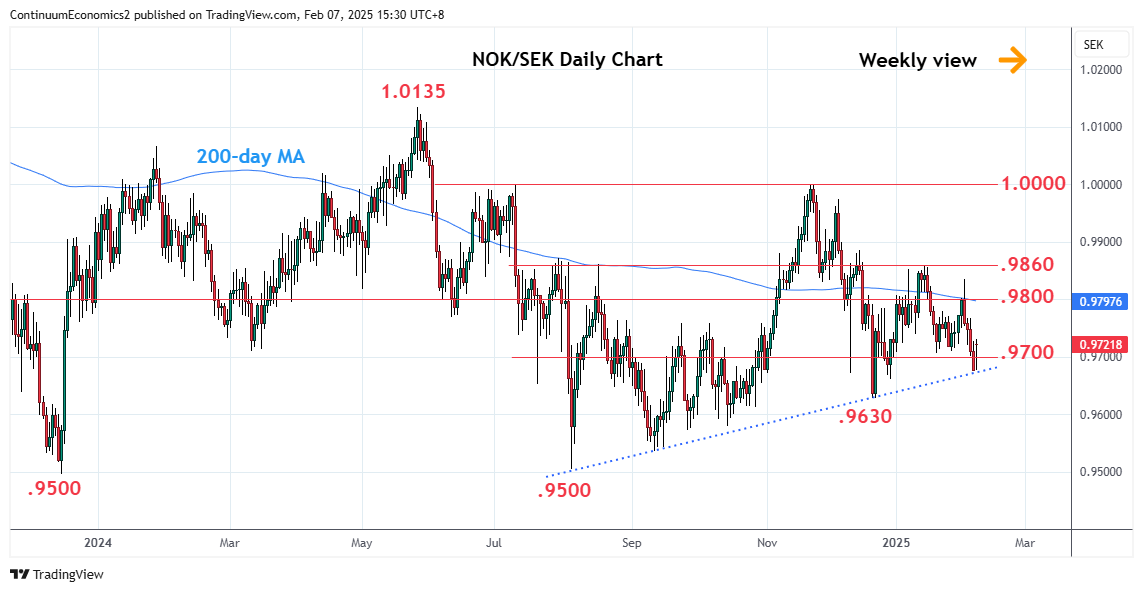
Break of the .9700 level has seen losses to reach the trendline support from the August low at .9675
| Levels | Imp | Comment | Levels | Imp | Comment | |||
|---|---|---|---|---|---|---|---|---|
| R4 | .9860 | ** | 15 Jan YTD high | S1 | .9675 | * | Aug trendline | |
| R3 | .9835 | * | 3 Feb high | S2 | .9630 | ** | Dec low | |
| R2 | .9800 | * | congestion | S3 | .9600 | * | congestion | |
| R1 | .9750 | congestion | S4 | .9535 | ** | Sep low |
Asterisk denotes strength of level
07:40 GMT - Break of the .9700 level has seen losses to reach the trendline support from the August low at .9675. Bounce here see prices consolidating the sharp drop from the .9835 high to unwind the oversold intraday studies. However, consolidation here is expected to give way to fresh selling pressure later where break will open up deeper pullback to retest the December low at .9630. Below the latter will extend the broader losses from the November parity level and see room to the .9600 level. Meanwhile, resistance is lowered to the .9750 congestion and this extend to the .9800 level, expected to cap.