Published: 2026-04-09T08:36:50.000Z
Chart USD/CHF Update: Consolidating losses - studies under pressure
2
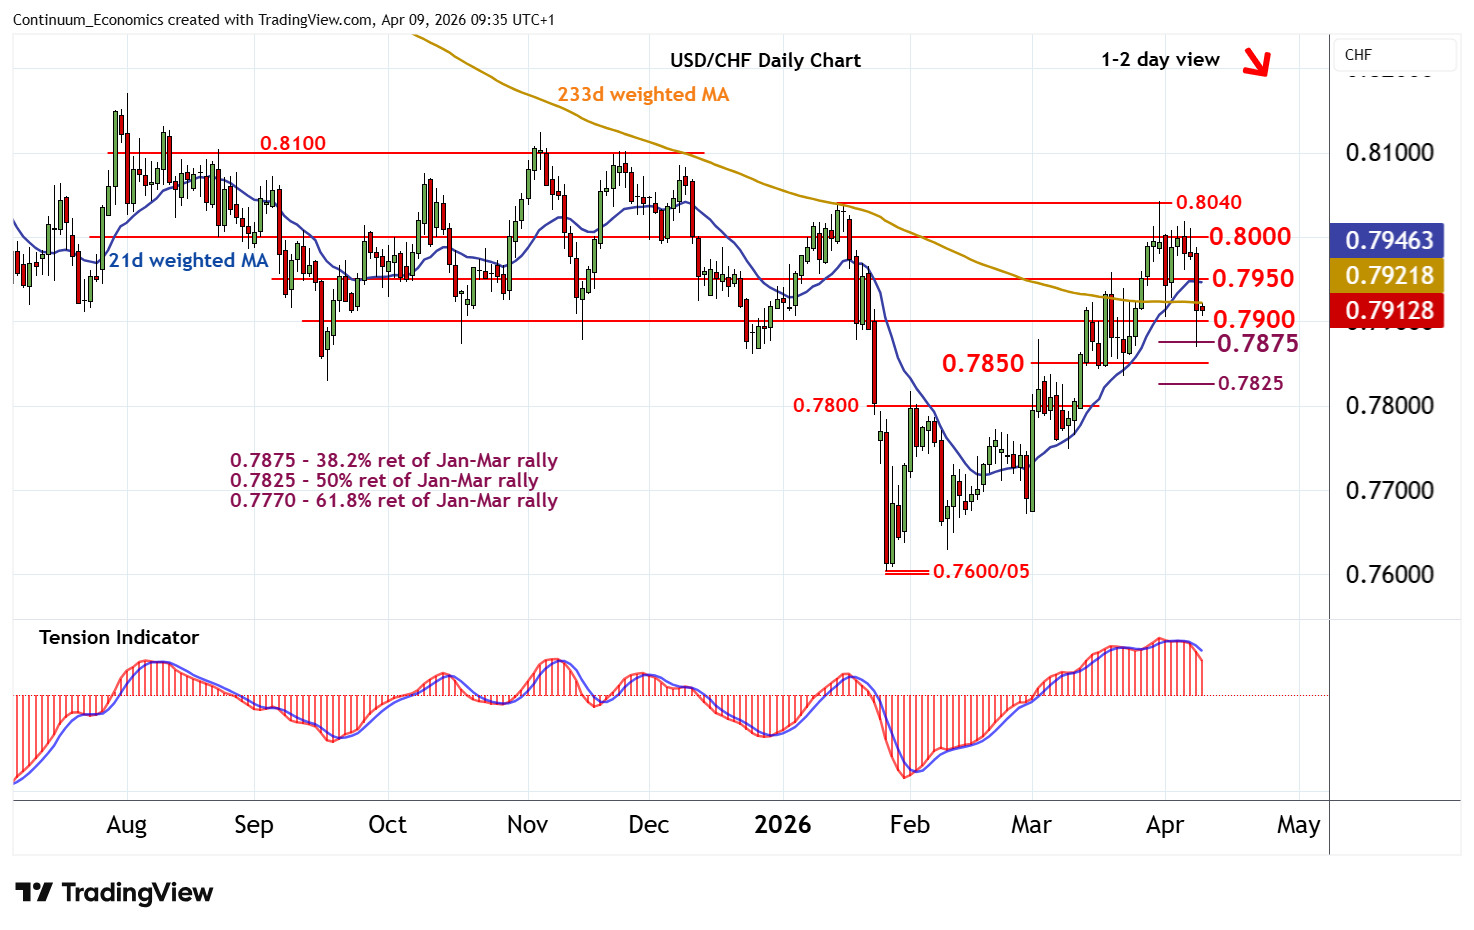
Consolidation following the test of support at the 0.7875 Fibonacci retracement has given way to a bounce
| Level | Comment | Level | Comment | |||||
|---|---|---|---|---|---|---|---|---|
| R4 | 0.8100 | ** | congestion | S1 | 0.7900 | ** | congestion | |
| R3 | 0.8040 | ** | 15-16 Jan YTD high | S2 | 0.7875 | ** | 38.2% ret of Jan-Mar rally | |
| R2 | 0.8000 | * | break level | S3 | 0.7850 | * | congestion, recent lows | |
| R1 | 0.7950 | * | congestion | S4 | 0.7825/35 | 50% ret; 23 Mar (w) low |
Asterisk denotes strength of level
09:20 BST - Consolidation following the test of support at the 0.7875 Fibonacci retracement has given way to a bounce, as negative intraday studies flatten, with prices currently balanced in fresh consolidation above 0.7900. Daily readings continue to point lower and overbought weekly stochastics are unwinding, highlighting room for fresh losses in the coming sessions. However, a close below 0.7875 is needed to turn sentiment negative and extend late-March losses initially towards 0.7850. Meanwhile, resistance is at congestion around 0.7950 and should cap any immediate tests higher.