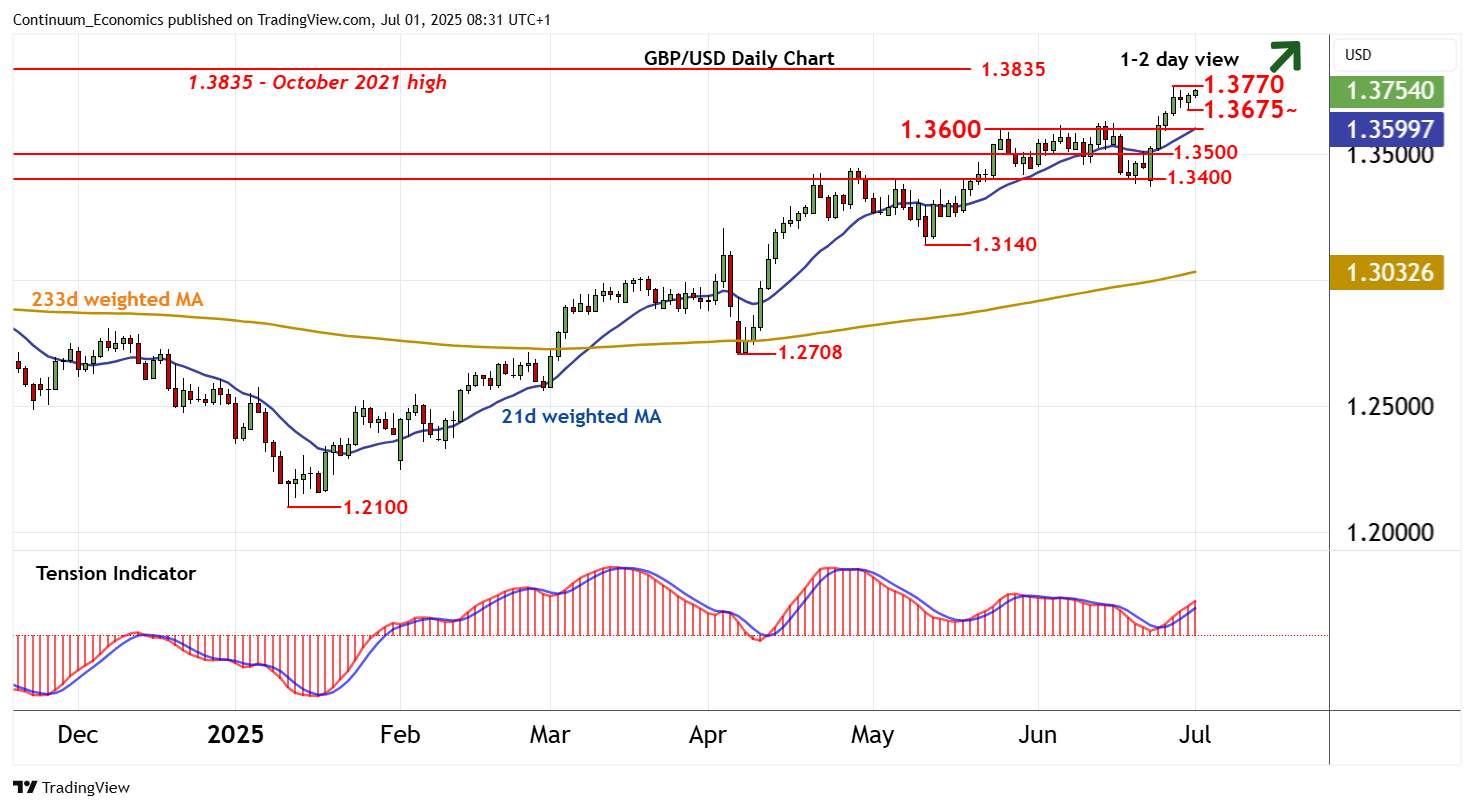
Chart GBP/USD Update: Within reach of current year highs

The anticipated retest below 1.3700 has bounced from 1.3675~
| Level | Comment | Level | Comment | |||||
|---|---|---|---|---|---|---|---|---|
| R4 | 1.3900 | ** | congestion | S1 | 1.3675~ | 30 Jun low | ||
| R3 | 1.3835 | * | October 2021 high | S2 | 1.3600 | * | congestion | |
| R2 | 1.3800 | * | break level | S3 | 1.3500 | ** | congestion | |
| R1 | 1.3770 | 26 Jun YTD high | S4 | 1.3400 | * | congestion |
Asterisk denotes strength of level
08:10 BST - The anticipated retest below 1.3700 has bounced from 1.3675~, as intraday studies turn higher once again, with prices once again within reach of strong resistance at the 1.3770 current year high of 26 June. Overbought daily stochastics are flat, suggesting potential for further consolidation beneath here. But the daily Tension Indicator is rising and weekly charts are positive, pointing to room for a later break. A close above here will extend broad September 2022 gains towards the 1.3835 high of October 2021, where the flattening weekly Tension Indicator could prompt renewed selling interest. Meanwhile, an unexpected close below the 1.3675~ low of 30 June will delay higher levels and add weight to sentiment, as focus then turns to congestion around 1.3600.