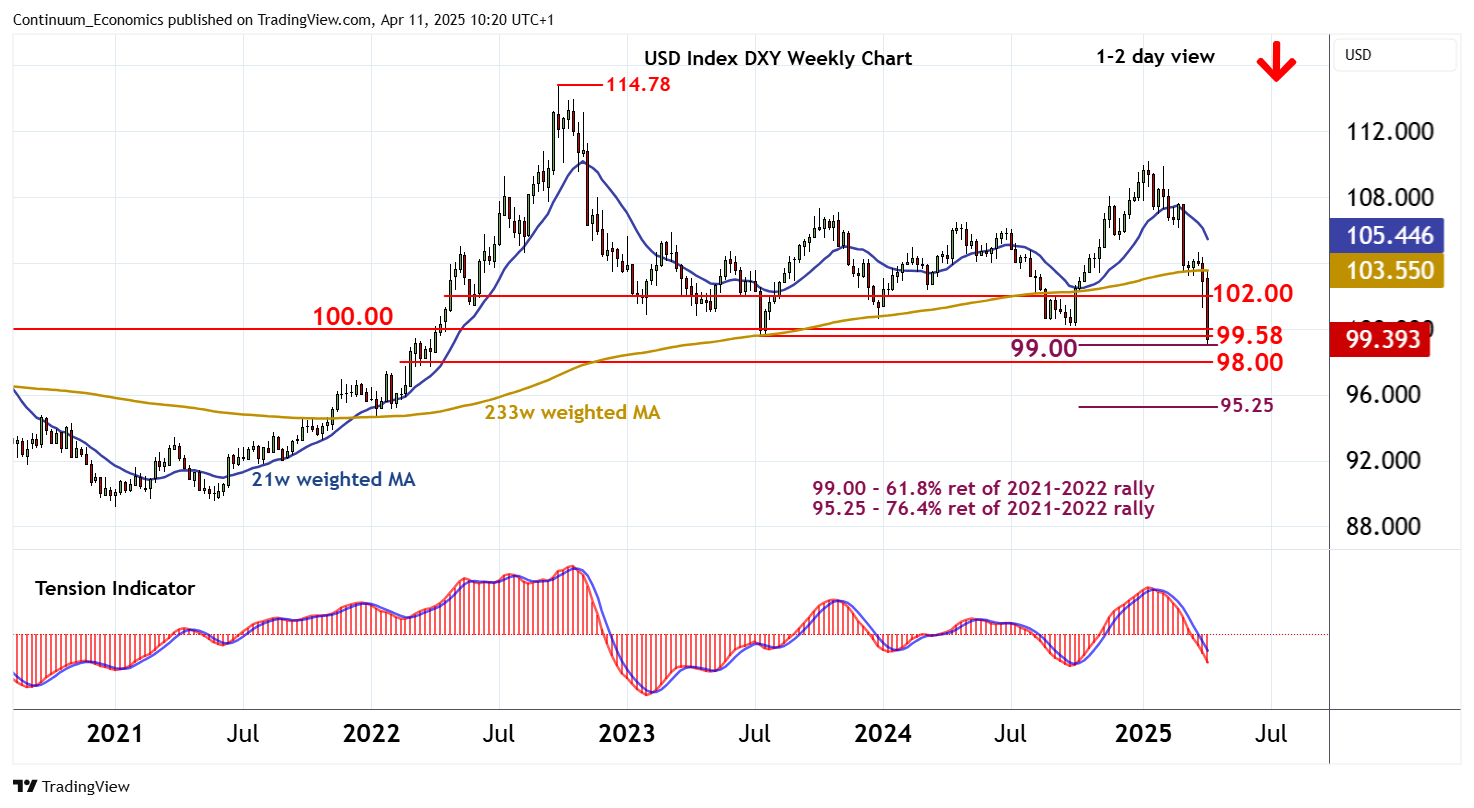
Chart USD Index DXY Update: Fresh 2025 lows within significant support at 99.00/58

Anticipated losses are extending, with sharp selling interest testing below critical support at the 99.58 year low of July 2023 to reach the 99.00 Fibonacci retracement
| Levels | Imp | Comment | Levels | Imp | Comment | |||
|---|---|---|---|---|---|---|---|---|
| R4 | 103.54 | 7 Apr high | S1 | 99.58 | ** | July 2023 (y) low | ||
| R3 | 103.00 | congestion | S2 | 99.00 | ** | 61.8% ret of 2021-2022 rally | ||
| R2 | 102.00 | ** | break level | S3 | 98.00 | * | congestion | |
| R1 | 100.00 | ** | congestion | S4 | 96.00 | ** | congestion |
Asterisk denotes strength of level
10:05 BST - Anticipated losses are extending, with sharp selling interest testing below critical support at the 99.58 year low of July 2023 to reach the 99.00 Fibonacci retracement. A bounce is appearing from here and prompting fresh trade around 99.58. But negative daily readings and bearish longer-term charts highlight room for still deeper losses. A close below 99.58 will add renewed weight to sentiment, with extension below 99.00 confirming completion of a multi-month distribution top. Focus will then turn initially to congestion around 98.00. Meanwhile, a close back above congestion resistance at 100.00 would help to stabilise price action and prompt consolidation beneath 102.00.