Chart USD/MYR Update: Extending consolidation at 4.4300

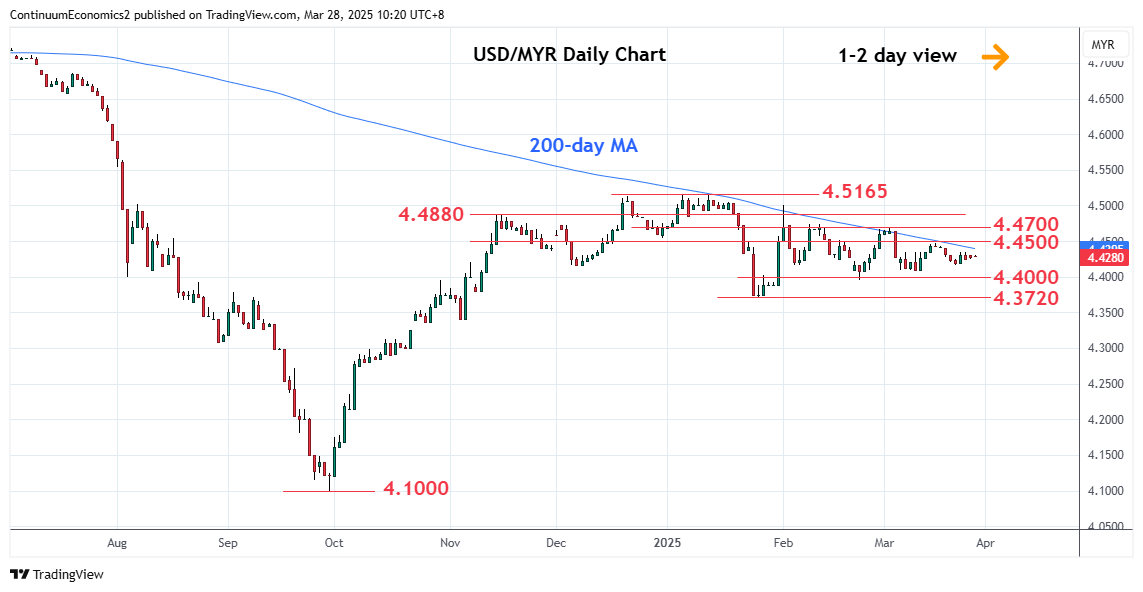
Drifting within a narrow range around the 4.4300 level as prices extend consolidation following rejection from the 4.4480 high
| Levels | Imp | Comment | Levels | Imp | Comment | |||
|---|---|---|---|---|---|---|---|---|
| R4 | 4.5000 | ** | Feb high | S1 | 4.4100 | * | 11 Mar low | |
| R3 | 4.4880 | * | Nov high | S2 | 4.4000 | * | congestion | |
| R2 | 4.4700 | ** | 4 Mar high | S3 | 4.3720 | ** | 27 Jan YTD low | |
| R1 | 4.4500 | * | congestion | S4 | 4.3400 | * | 5 Nov low |
Asterisk denotes strength of level
02:30 GMT - Drifting within a narrow range around the 4.4300 level as prices extend consolidation following rejection from the 4.4480 high of last week. Daily studies have turned mixed and suggest further ranging action below the latter with prices are leaning lower below the 200-day MA and suggest scope for test of the 4.4100 congestion and 4.4000 support. Break of the latter will return focus to the 4.3720, January YTD low. Break of the latter will see room for deeper pullback to retrace the September/January rally. Meanwhile, resistance at the 4.4500/4.4700 congestion expected to cap and sustain losses from the 4.5000, February high.