Published: 2025-11-18T00:44:01.000Z
Chart NZD/USD Update: Leaning lower in range
1
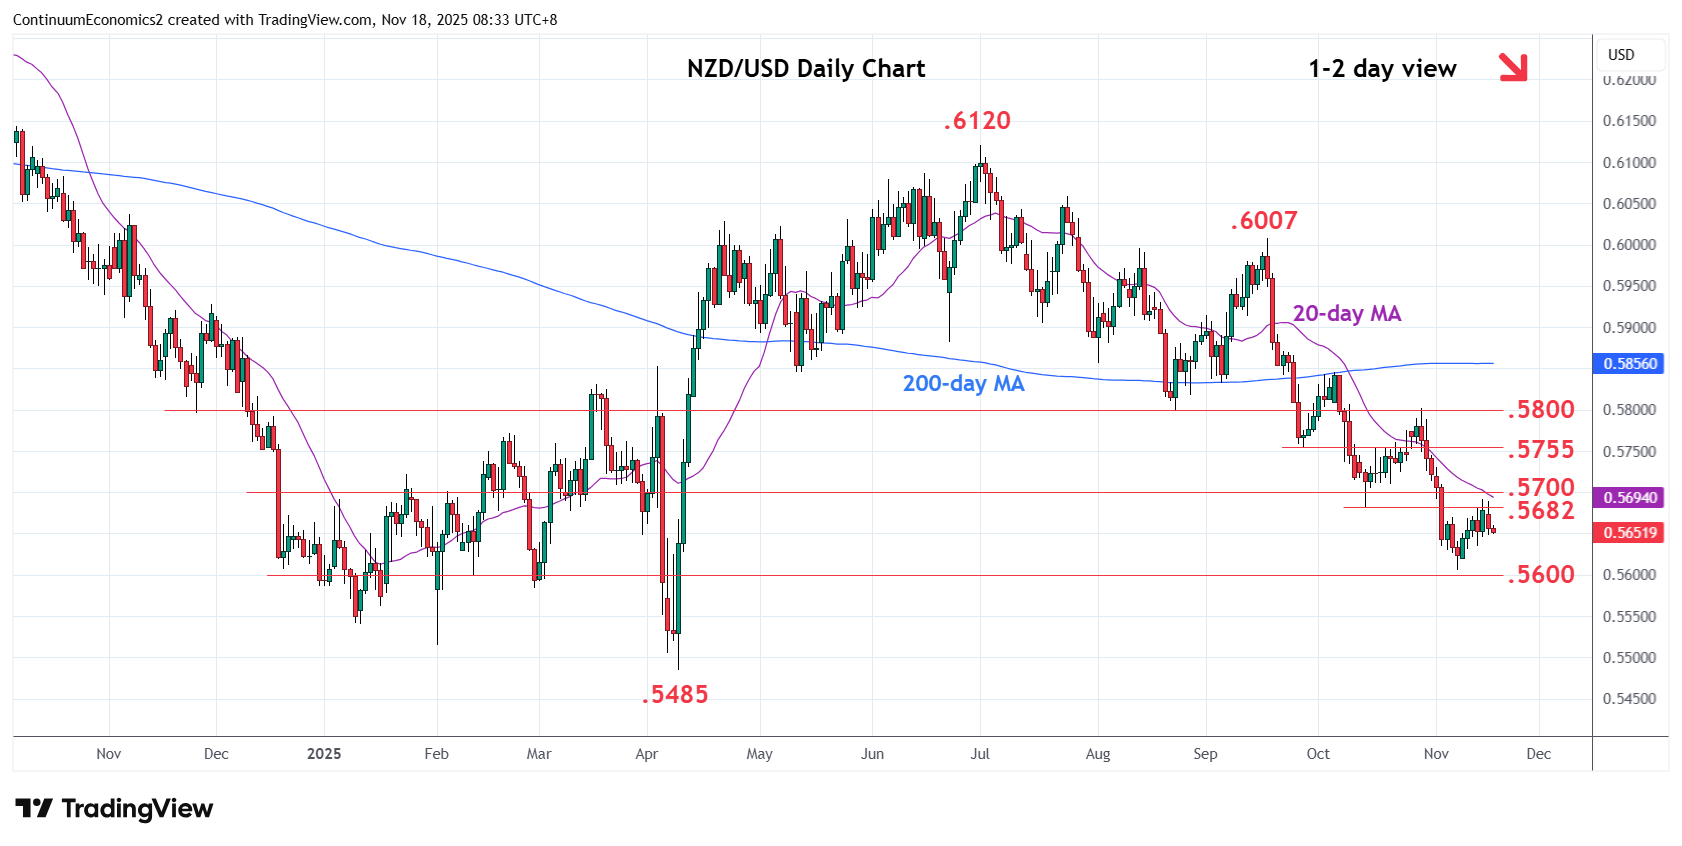
Leaning lower in range as resistance at the .5682/.5700 area caps and see pressure returning to the .5650/45 congestion
| Levels | Imp | Comment | Levels | Imp | Comment | |||
|---|---|---|---|---|---|---|---|---|
| R4 | .5850/55 | ** | congestion, 1 Aug low | S1 | .5650/45 | congestion, 14 Nov low | ||
| R3 | .5800 | ** | Aug low | S2 | .5606/00 | ** | 7 Jan low, congestion | |
| R2 | .5755 | * | Sep low | S3 | .5585 | * | 2 Jan low | |
| R1 | .5700 | * | congestion | S4 | .5550 | * | congestion |
Asterisk denotes strength of level
00:35 GMT - Leaning lower in range as resistance at the .5682/.5700 area caps and see pressure returning to the .5650/45 congestion and Friday's low. Break here will return focus to the .5606 low but reaction here can be expected on retest as weekly studies push deep into oversold area. Failure to hold this will see room for extension to .5585/.5550 area but focus will return to the .5485, April current year low. Meanwhile, resistance at the .5682/.5700 area now expected to cap and limit any corrective bounce.