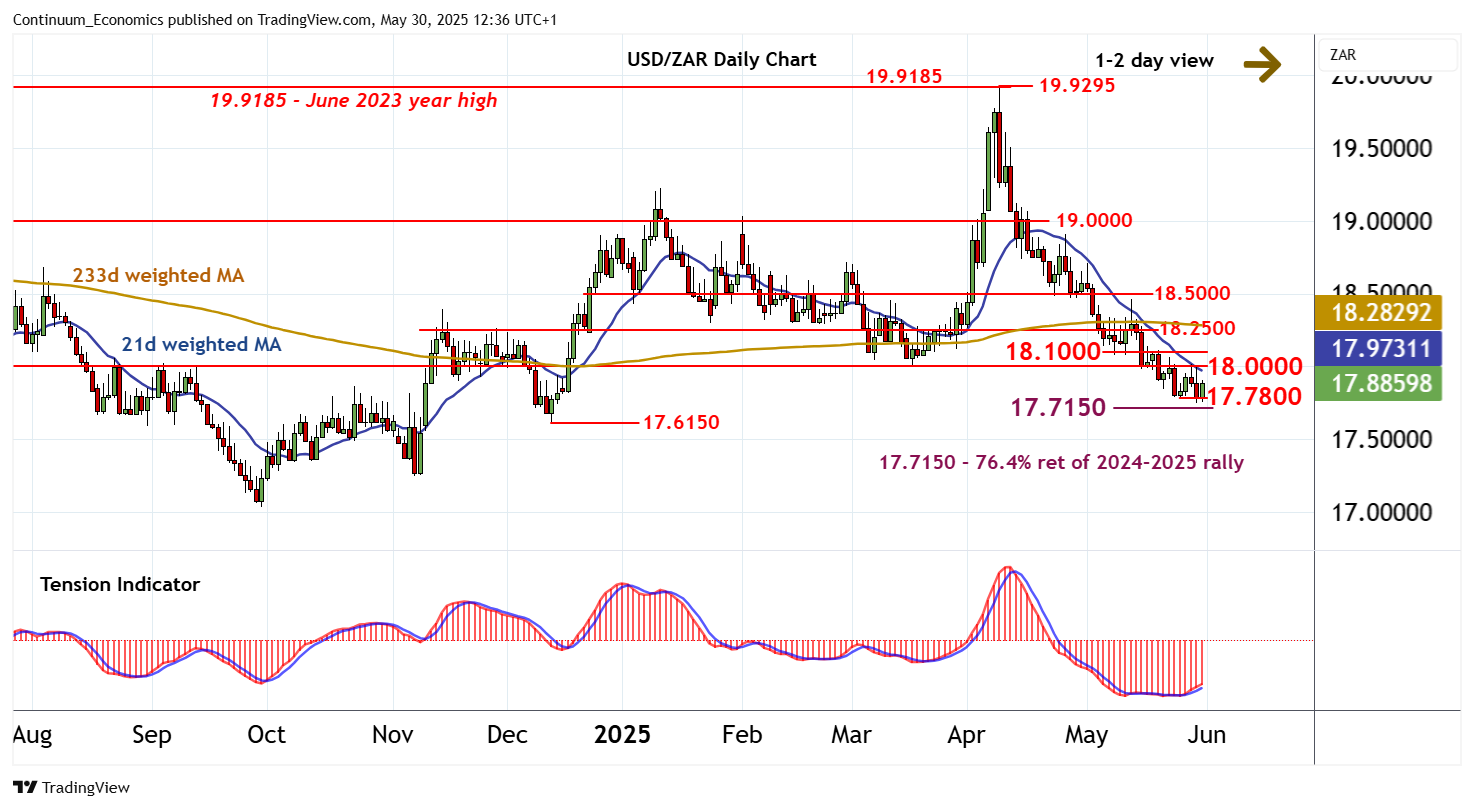
Chart USD/ZAR Update: Limited tests higher

The anticipated test of support at the 17.7800 low of 26 May is giving way to a bounce
| Level | Comment | Level | Comment | |||||
|---|---|---|---|---|---|---|---|---|
| R4 | 18.5000 | ** | break level | S1 | 17.7800 | ** | 26 May low | |
| R3 | 18.2500 | * | congestion | S2 | 17.7150 | ** | 76.4% ret of 2024-2025 rally | |
| R2 | 18.1000 | * | break level | S3 | 17.6150 | ** | 12 Dec (m) low | |
| R1 | 18.0000 | ** | congestion | S4 | 17.5000 | * | congestion |
Asterisk denotes strength of level
12:00 BST - The anticipated test of support at the 17.7800 low of 26 May is giving way to a bounce, as intraday studies turn higher, with prices currently trading around 17.8880. Daily stochastics and the daily Tension Indicator continue to rise, highlighting room for a test of congestion resistance at 18.0000 and the 18.1000 break level. But negative weekly charts should prompt fresh selling interest within this range. Following corrective trade, lower levels are looked for. But a close below the 17.7150 Fibonacci retracement is needed to add weight to sentiment and extend April losses towards the 17.6150 monthly low of 12 December.