Published: 2026-03-12T13:50:10.000Z
Chart USD/JPY Update: Pressuring year highs
7
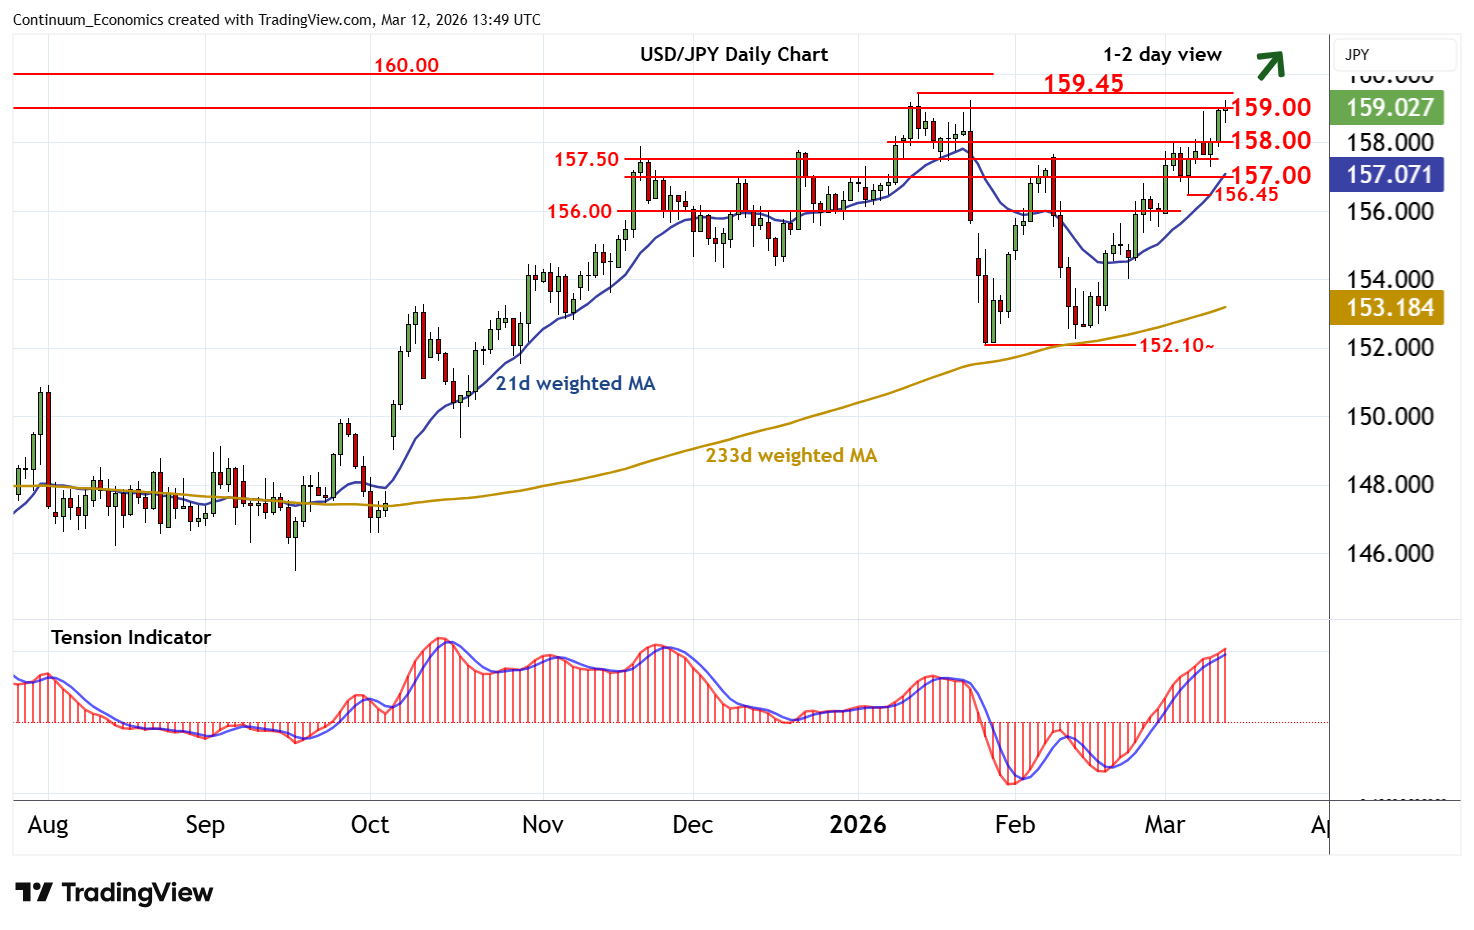
Little change, as prices consolidate the test of resistance at the 158.90 high of 9 March and congestion around 159.00
| Levels | Imp | Comment | Levels | Imp | Comment | |||
|---|---|---|---|---|---|---|---|---|
| R4 | 160.40 | ** | April 1990 (y) high | S1 | 158.00 | * | break level | |
| R3 | 160.00 | ** | historic congestion | S2 | 157.00 | congestion | ||
| R2 | 159.45 | ** | 14 Jan YTD high | S3 | 156.45 | * | 4 Mar low | |
| R1 | 158.90/00 | * | 9 Mar high; cong | S4 | 156.00 | * | congestion |
Asterisk denotes strength of level
13:40 GMT - Little change, as prices consolidate the test of resistance at the 158.90 high of 9 March and congestion around 159.00. Daily readings continue to rise and broader weekly charts are positive, highlighting room for further strength in the coming sessions. A close above critical resistance at the 159.45 current year high of 14 January is needed to turn sentiment positive and extend long-term bullish trends towards fresh resistance within 160.00/40. Meanwhile, support remains at the 158.00 break level. Any tests beneath here should give way to consolidation above 157.00.