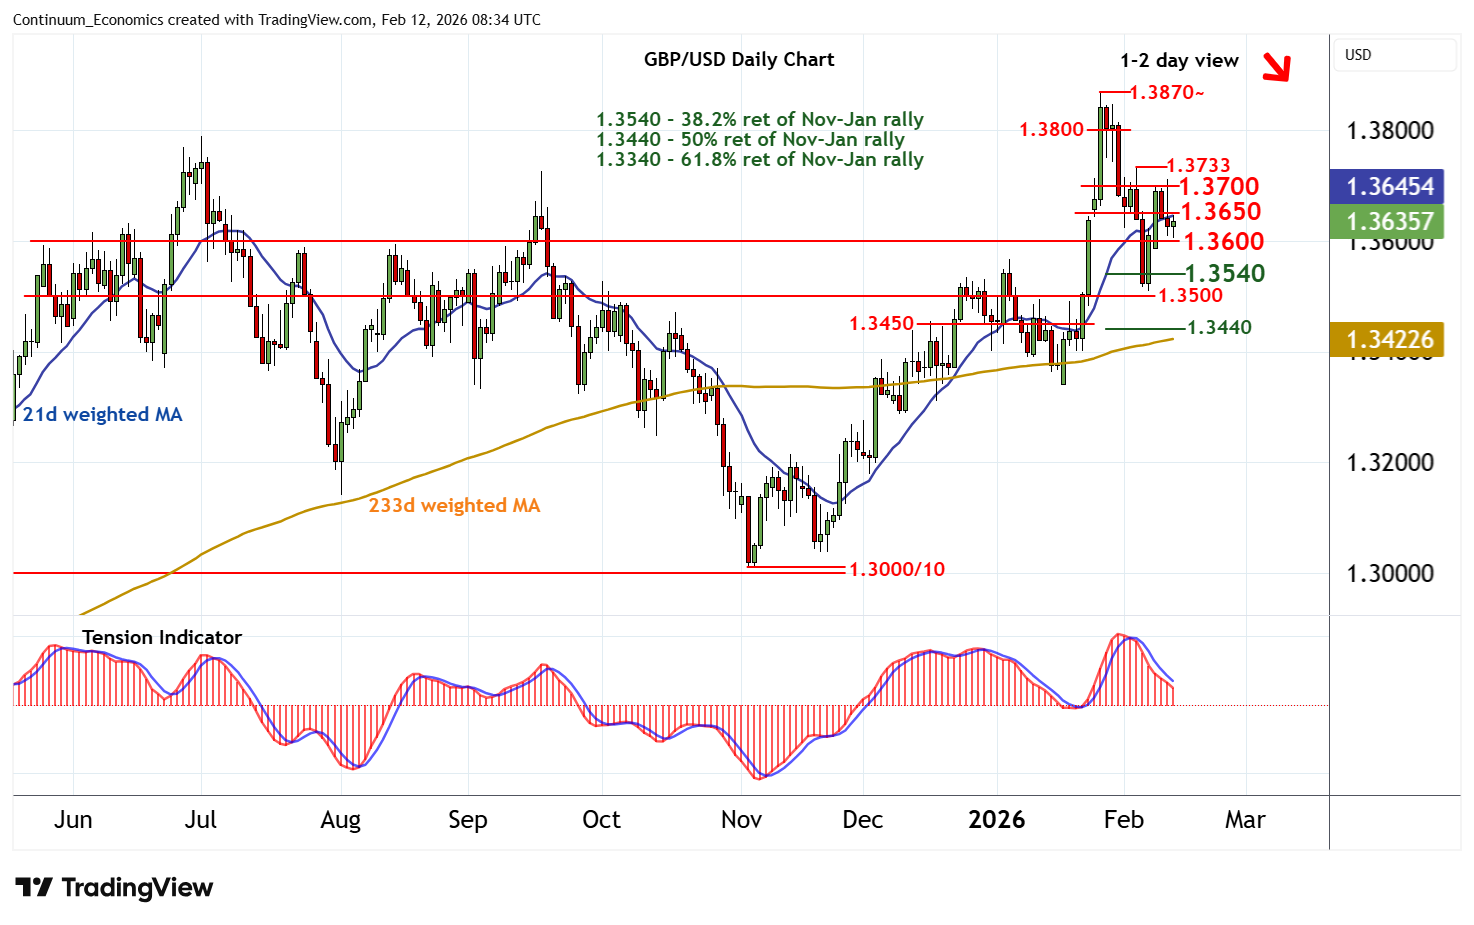
Chart GBP/USD Update: Leaning lower
The anticipated test of resistance at 1.3700 has given way to a pullback
| Level | Comment | Level | Comment | |||||
|---|---|---|---|---|---|---|---|---|
| R4 | 1.3800 | * | congestion | S1 | 1.3600 | * | congestion | |
| R3 | 1.3733 | * | 4 Feb (w) high | S2 | 1.3540 | * | 38.2% ret of Nov-Jan rally | |
| R2 | 1.3700 | break level | S3 | 1.3500/10~ | ** | congestion; 6 Feb (w) low | ||
| R1 | 1.3650 | * | break level | S4 | 1.3440/50 | ** | 50% ret; congestion |
Asterisk denotes strength of level
08:10 GMT - The anticipated test of resistance at 1.3700 has given way to a pullback, with prices drifting lower into consolidation within the 1.3600 - 1.3650 range. Daily stochastics have ticked lower and the daily Tension Indicator is bearish, highlighting a deterioration in price action and room for further losses in the coming sessions. A break below congestion support at 1.3600 will open up the 1.3540 Fibonacci retracement. But mixed/positive weekly charts should limit any initial tests beneath here in consolidation above strong support at 1.3500/10. A close beneath here would turn sentiment negative and confirm continuation of late-January losses. Meanwhile, a close back above 1.3650 would help to stabilise price action and give way to consolidation beneath 1.3700.