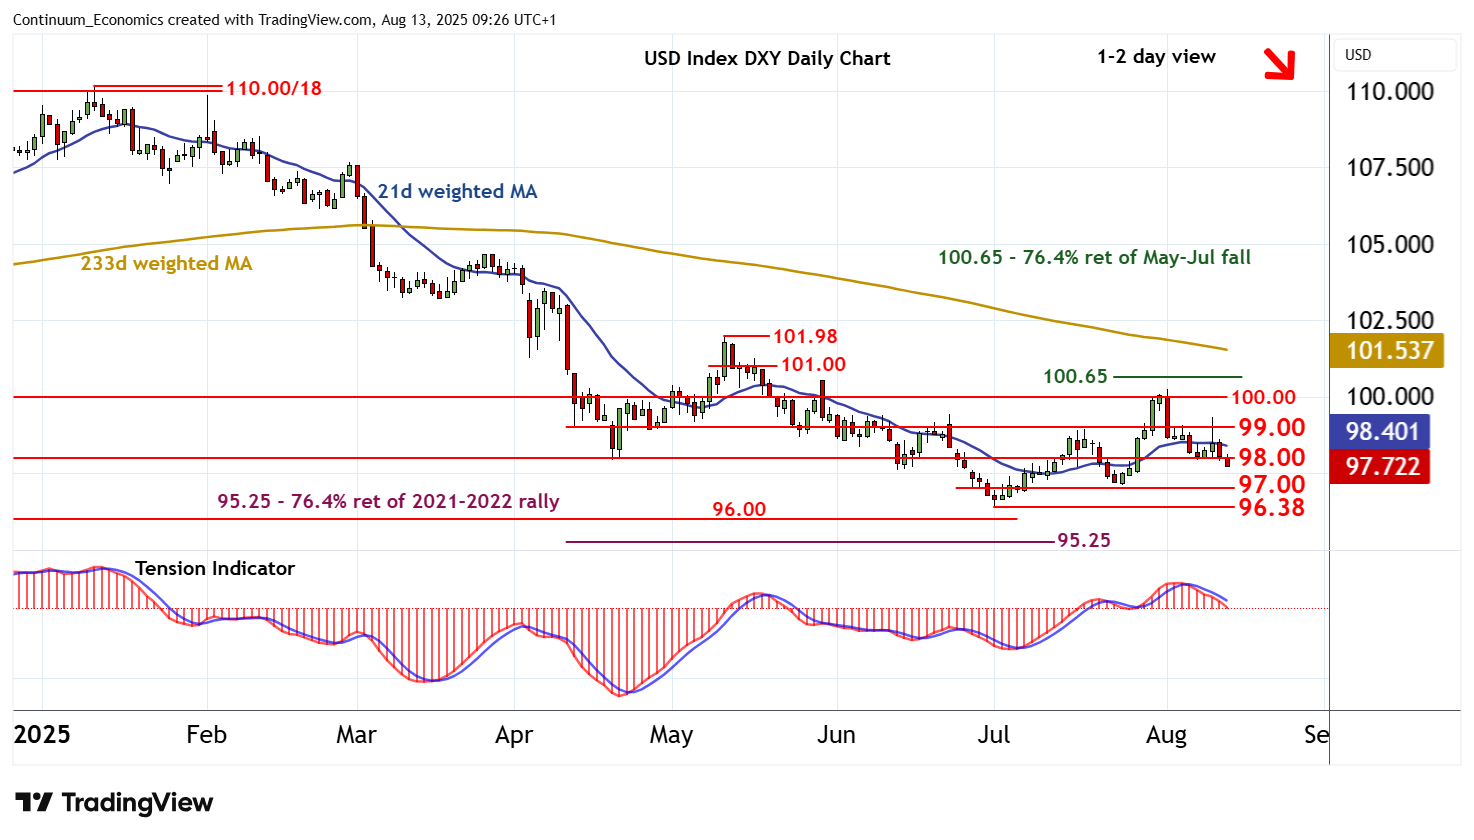
Chart USD Index DXY Update: Under pressure

The anticipated break lower from recent consolidation around 98.50 is extending
| Levels | Imp | Comment | Levels | Imp | Comment | |||
|---|---|---|---|---|---|---|---|---|
| R4 | 100.54 | ** | 29 May (w) high | S1 | 97.00 | * | congestion | |
| R3 | 100.00 | ** | congestion | S2 | 96.50 | congestion | ||
| R2 | 99.00 | * | break level | S3 | 96.38 | ** | 1 Jul YTD low | |
| R1 | 98.00 | * | congestion | S4 | 96.00 | ** | historic congestion |
Asterisk denotes strength of level
09:20 BST - The anticipated break lower from recent consolidation around 98.50 is extending, with the break below 98.00 adding weight to sentiment. Intraday studies are negative and daily readings have also turned down, highlighting room for continuation of August losses towards congestion support at 97.00. However, broader weekly charts are mixed/positive, suggesting any deeper losses should be limited in consolidation above critical support at the 96.38 current year low of 1 July. Meanwhile, resistance is lowered to congestion around 98.00. A close above here, if seen, will help to stabilise price action and prompt fresh consolidation beneath 99.00.