Chart USD/ZAR Update: Lower towards critical support
Cautious trade has given way to anticipated selling interest
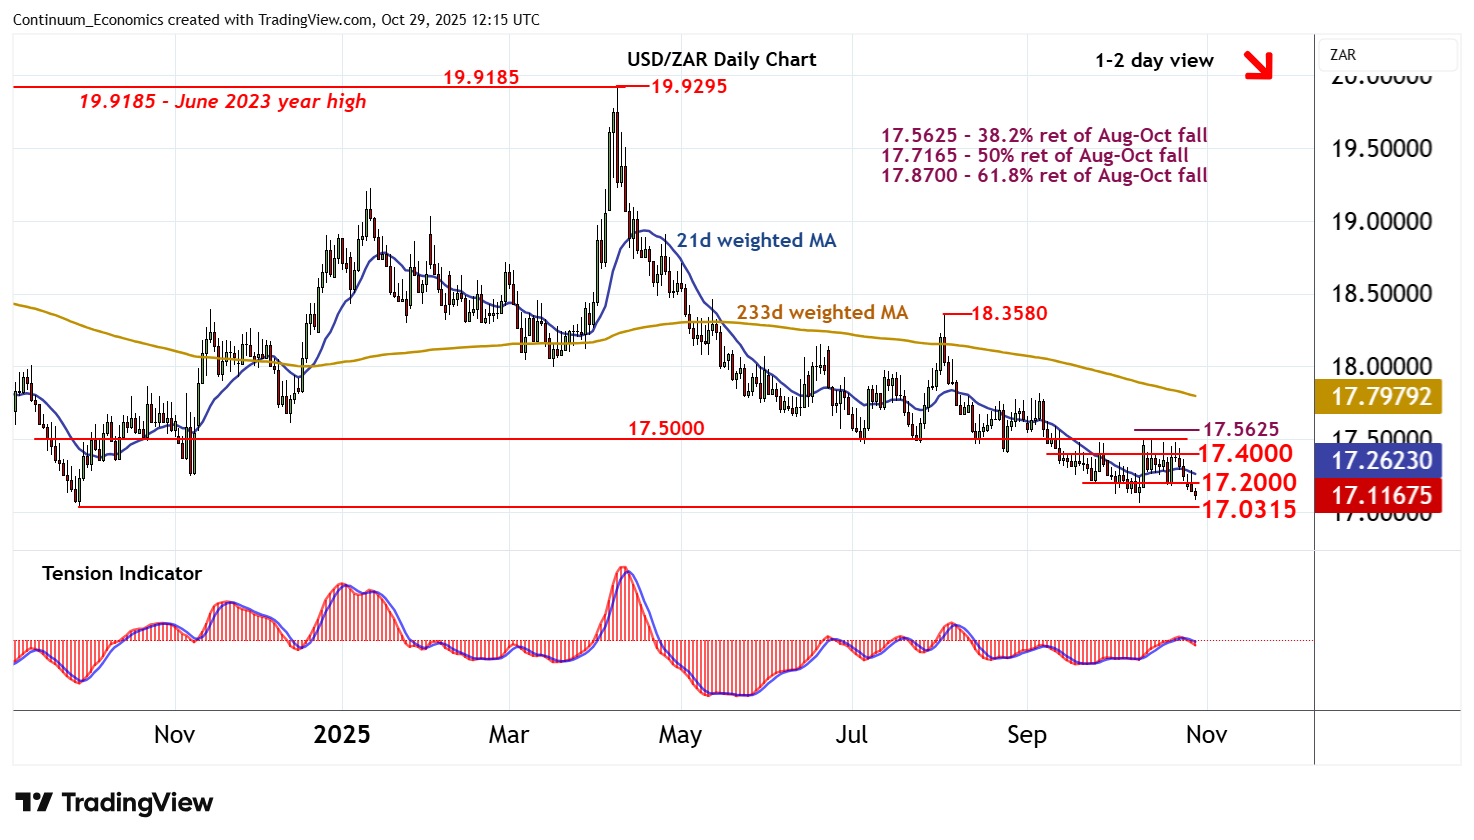
| Level | Comment | Level | Comment | |||||
|---|---|---|---|---|---|---|---|---|
| R4 | 17.5625 | * | 38.2% ret of Aug-Oct fall | S1 | 17.0630 | * | 9 Oct YTD low | |
| R3 | 17.5000 | ** | congestion | S2 | 17.0315 | ** | 30 Sep 2024 (y) low | |
| R2 | 17.4000 | congestion | S3 | 17.0000 | ** | congestion | ||
| R1 | 17.2000 | * | congestion | S4 | 16.6900 | ** | Jan 2023 (m) low |
Asterisk denotes strength of level
12:00 GMT - Cautious trade has given way to anticipated selling interest, with the break below 17.2000 adding weight to sentiment and putting focus on critical support at the 17.0315 year low of 30 September 2024 and the 17.0630 current year low of 9 October. Daily readings are bearish and broader weekly charts are under pressure, highlighting room for further losses in the coming sessions. A close beneath here will sentiment negative and confirm a deeper corrective of the broad 2021-2023 rally, as focus then turns to the 16.6900 monthly low of January 2023. Meanwhile, a close back above congestion resistance at 17.2000, if seen, would help to stabilise price action and prompt consolidation beneath further congestion around 17.4000.