Chart USD Index DXY Update: Sharp pullback from 99.00/31
Cautious trade beneath the 99.31 weekly high of 9 December has given way to anticipated selling interest
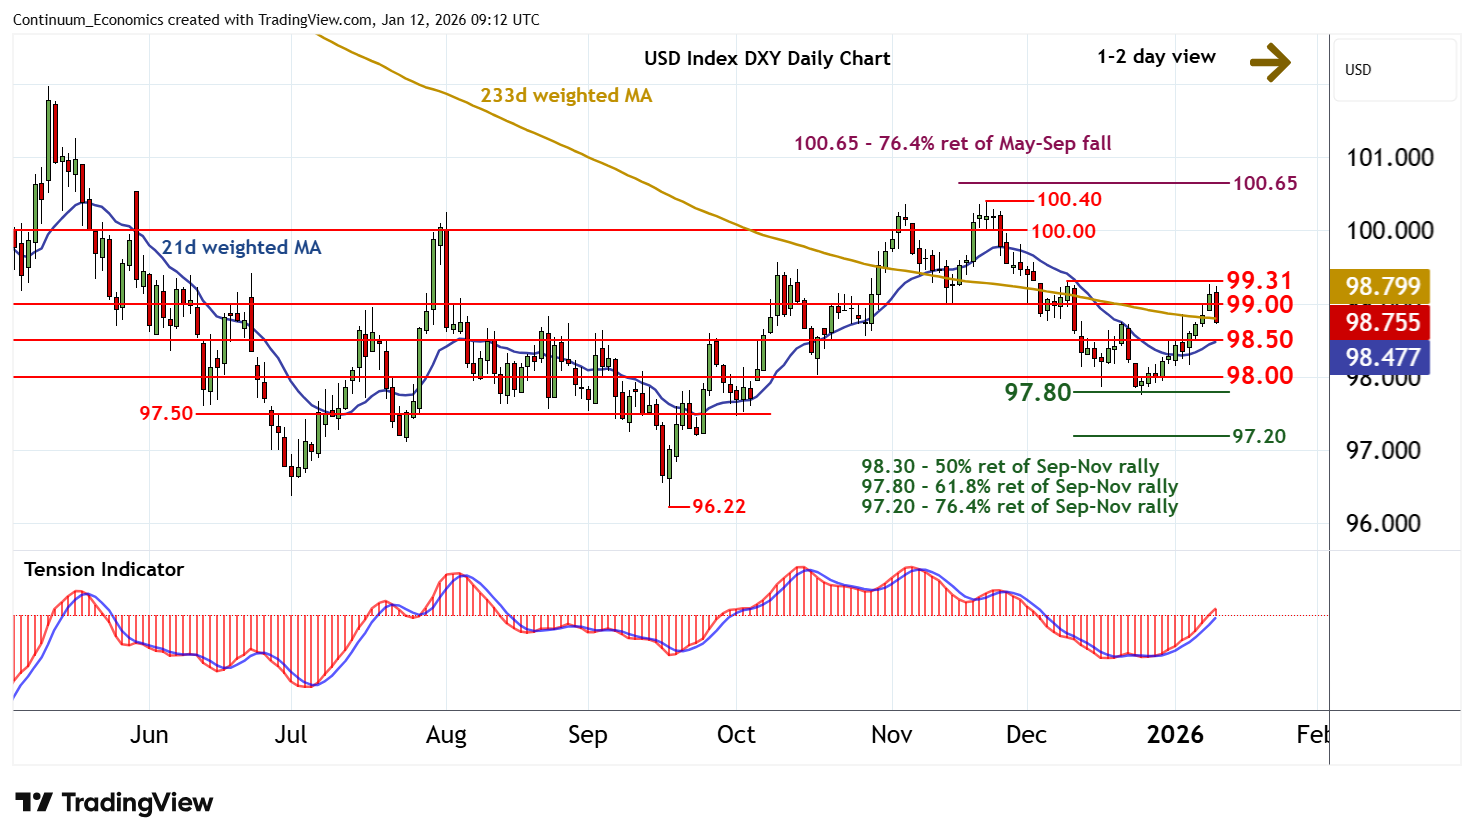
| Levels | Imp | Comment | Levels | Imp | Comment | |||
|---|---|---|---|---|---|---|---|---|
| R4 | 100.40 | ** | 21 Nov (m) high | S1 | 98.50 | * | congestion | |
| R3 | 100.00 | ** | congestion | S2 | 98.00 | * | congestion | |
| R2 | 99.26/31 | * | 9 Jan; 9 Dec (w) highs | S3 | 97.80 | ** | 61.8% ret of Sep-Nov rally | |
| R1 | 99.00 | * | congestion | S4 | 97.50 | congestion |
Asterisk denotes strength of level
09:00 GMT - Cautious trade beneath the 99.31 weekly high of 9 December has given way to anticipated selling interest, with the break below 99.00 turning sentiment neutral. Intraday studies are negative and overbought daily stochastics are ticking lower, highlighting room for a test of congestion support at 98.50. But the rising daily Tension Indicator and flattening weekly charts should limit any break in renewed buying interest/consolidation above further congestion around 98.00. Meanwhile, an unexpected break above 99.31 will improve price action and extend late-December gains towards strong resistance at 100.00.