Published: 2024-11-25T17:19:31.000Z
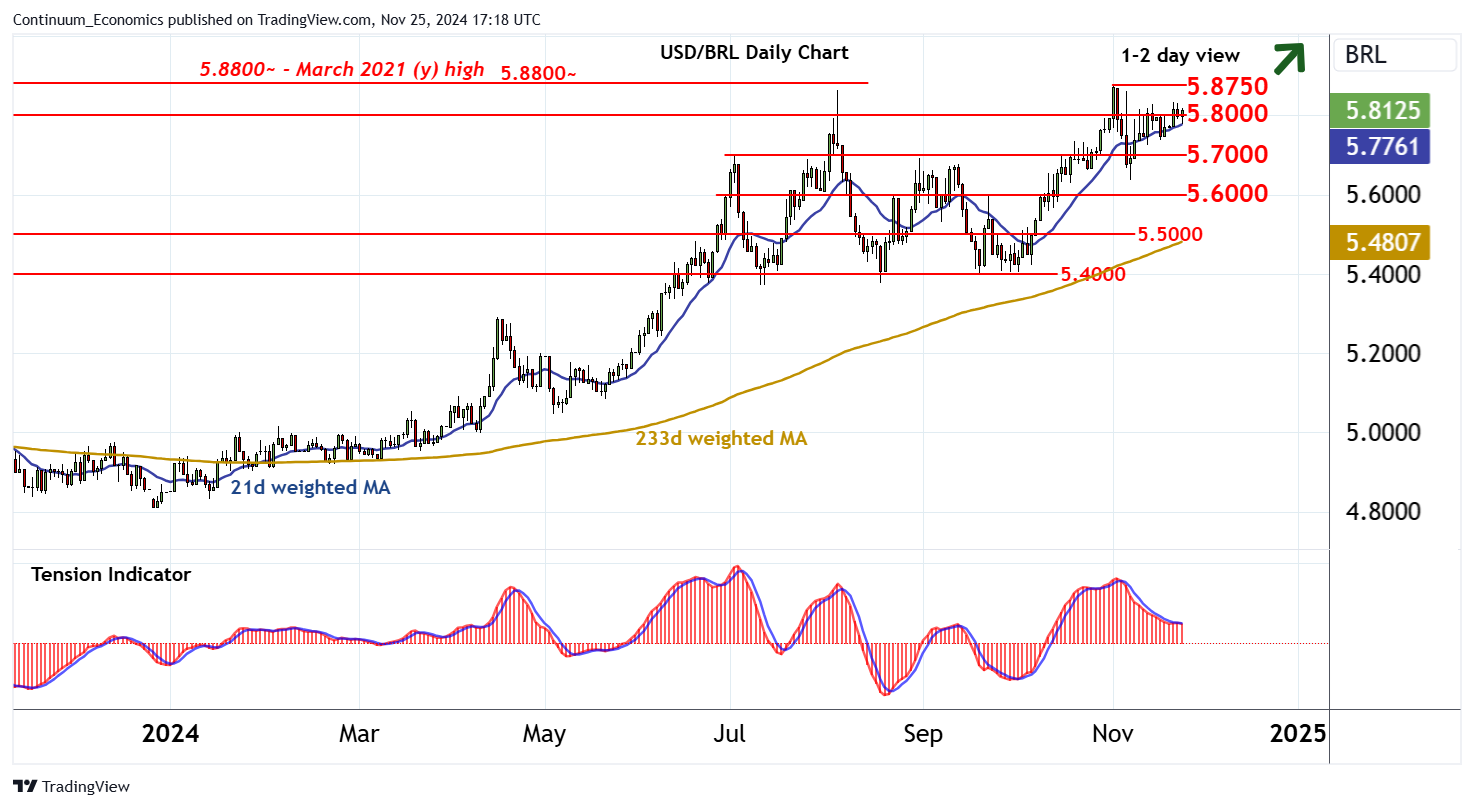
Chart USD/BRL Update: Balanced around 5.8000 - studies edging higher

Senior Technical Strategist
-

Minor losses have bounced from above support at 5.7000

| Levels | Imp | Comment | Levels | Imp | Comment | |||
|---|---|---|---|---|---|---|---|---|
| R4 | 5.9900 | ** | May 2020 (y) high | S1 | 5.7000 | * | break level | |
| R3 | 5.8800~ | ** | March 2021 (y) high | S2 | 5.6000 | * | congestion | |
| R2 | 5.8750 | ** | 1 Nov YTD high | S3 | 5.5000 | * | break level | |
| R1 | 5.8000 | ** | break level | S4 | 5.4000 | congestion |
Asterisk denotes strength of level
17:00 GMT - Minor losses have bounced from above support at 5.7000, with prices currently consolidating around 5.8000. Daily readings are rising and broader weekly charts have ticked higher, highlighting room for a break above here towards the 5.8750 current year high of 1 November and the 5.8800~ year high of March 2021. A further close above here would turn sentiment positive and extend April 2022 gains towards critical resistance at the 5.9900 all-time high of May 2020. Mixed longer-term readings, however, could limit any initial tests in fresh profit-taking. Meanwhile, support is down to the 5.7700 break level. A close beneath here, if seen, would add weight to sentiment and confirm a near-term top in place at 5.8750, as focus then turns to congestion around 5.6000.