Published: 2025-02-21T14:06:04.000Z
Chart USD/JPY Update: Consolidating test of the 149.20 Fibonacci retracement

Senior Technical Strategist
1
The anticipated break below 150.00 has reached the 149.20 Fibonacci retracement
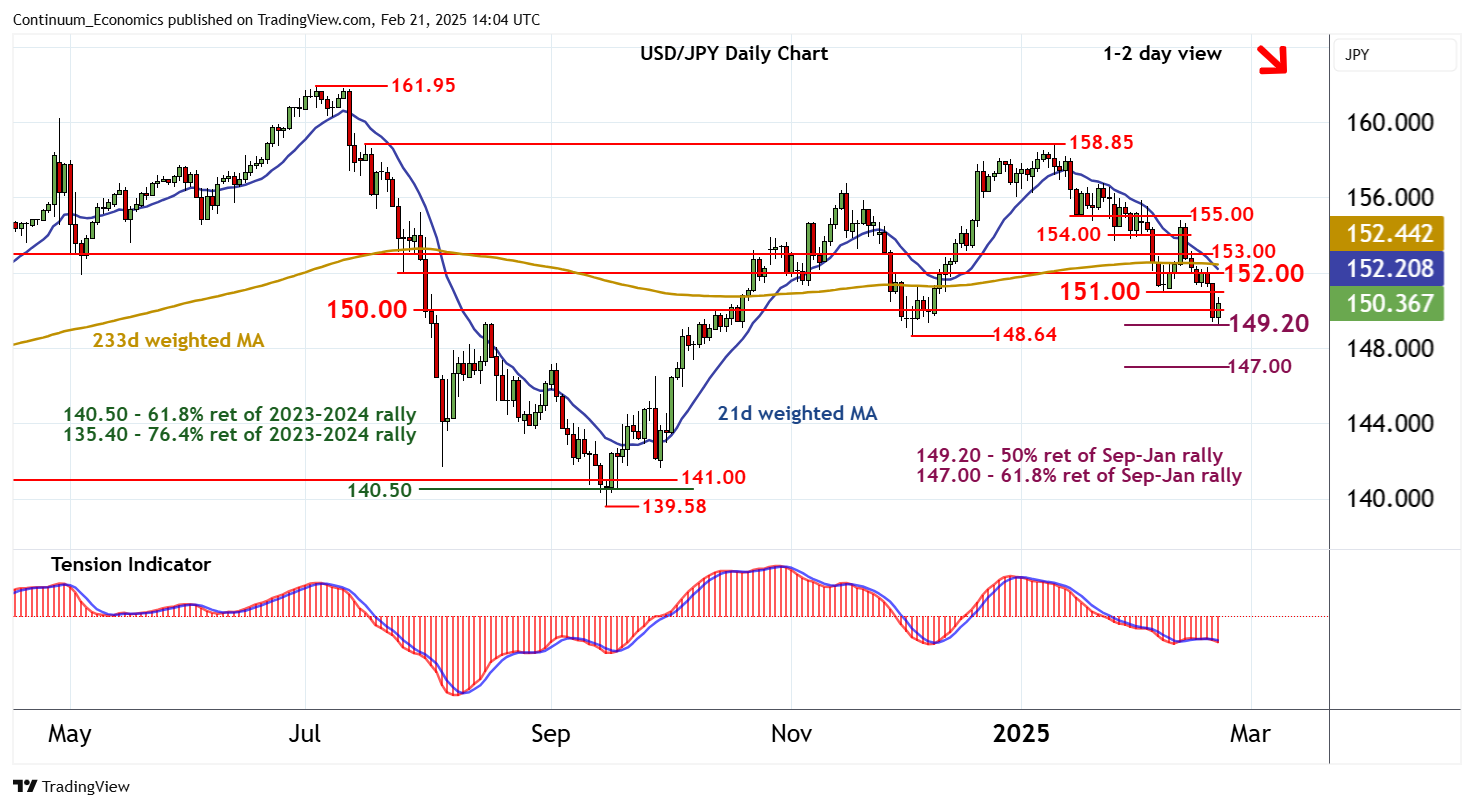
| Levels | Imp | Comment | Levels | Imp | Comment | |||
|---|---|---|---|---|---|---|---|---|
| R4 | 154.00 | * | congestion lows | S1 | 150.00 | ** | congestion | |
| R3 | 153.00 | ** | congestion | S2 | 149.20 | ** | 50% ret of Sep-Jan rally | |
| R2 | 152.00 | * | break level | S3 | 148.64 | ** | 3 Dec (m) low | |
| R1 | 151.00 | * | break level | S4 | 148.00 | * | congestion |
Asterisk denotes strength of level
13:55 GMT - The anticipated break below 150.00 has reached the 149.20 Fibonacci retracement, where unwinding oversold intraday studies have prompted a bounce back above 150.00. Fcus is on resistance at the 151.00 break level. But negative daily readings and bearish weekly charts are expected to limit any tests in renewed selling interest. Following cautious trade, fresh losses are looked for. A later close below 149.20 will add weight to sentiment and extend January losses towards the 148.64 monthly low of 3 December. Meanwhile, an unexpected close above 151.00 will turn sentiment neutral and prompt consolidation beneath 152.00.