Published: 2025-12-05T01:50:40.000Z
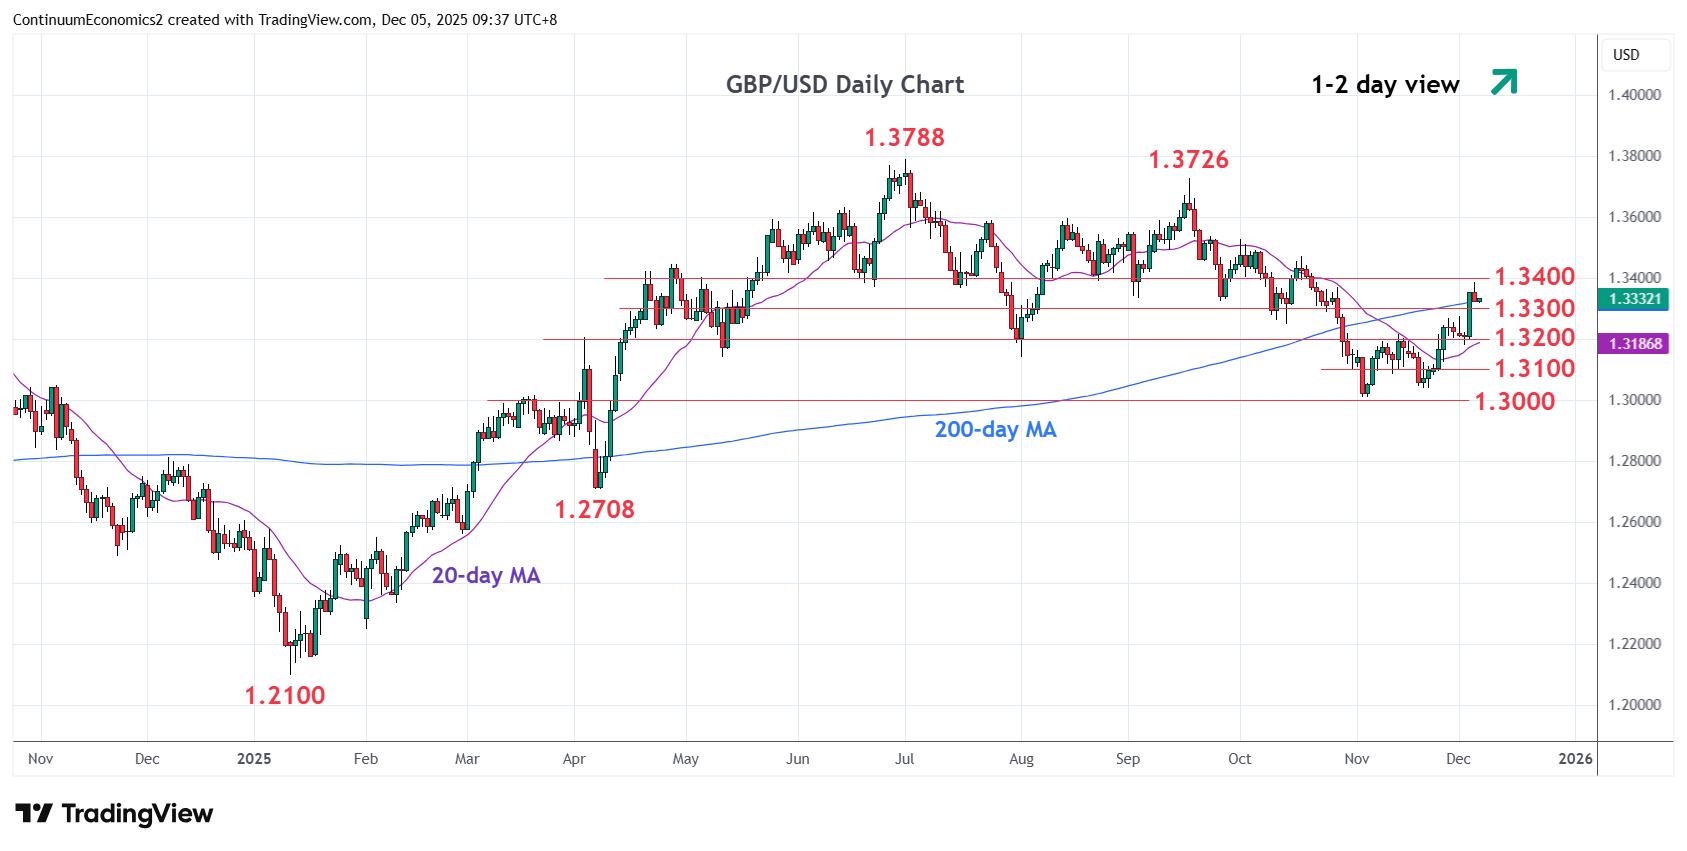
Chart GBP/USD Update: Consolidating test of 1.3370/1.3400 resistance
5
Settled back from test of resistance at the 1.3370/1.3400 area as prices unwind overbought intraday studies
| Level | Comment | Level | Comment | |||||
|---|---|---|---|---|---|---|---|---|
| R4 | 1.3500/27 | ** | congestion, 1 Oct high | S1 | 1.3300 | * | congestion | |
| R3 | 1.3471 | * | 17 Oct high | S2 | 1.3215/00 | ** | 13 Nov high, congestion | |
| R2 | 1.3400 | * | congestion | S3 | 1.3140 | * | Aug low | |
| R1 | 1.3370 | * | 28 Oct high | S4 | 1.3100 | * | congestion |
Asterisk denotes strength of level
01:45 GMT - Settled back from test of resistance at the 1.3370/1.3400 area as prices unwind overbought intraday studies. Positive daily and weekly studies suggest consolidation giving way to renewed buying interest later to further retrace the September/November losses. Above the 1.3400 level will open up room for extension to the 1.3471 resistance then the strong resistance at the 1.3500/27 area. Meanwhile, support is raised to the 1.3300/1.3275 area which should now underpin and sustains gains from the 1.3038/10, November lows.