Published: 2026-03-27T16:47:28.000Z
Chart USD/CAD Update: Pressuring strong resistance - studies rising
6
Cautious trade has given way to anticipated gains
| Levels | Imp | Comment | Levels | Imp | Comment | |||
|---|---|---|---|---|---|---|---|---|
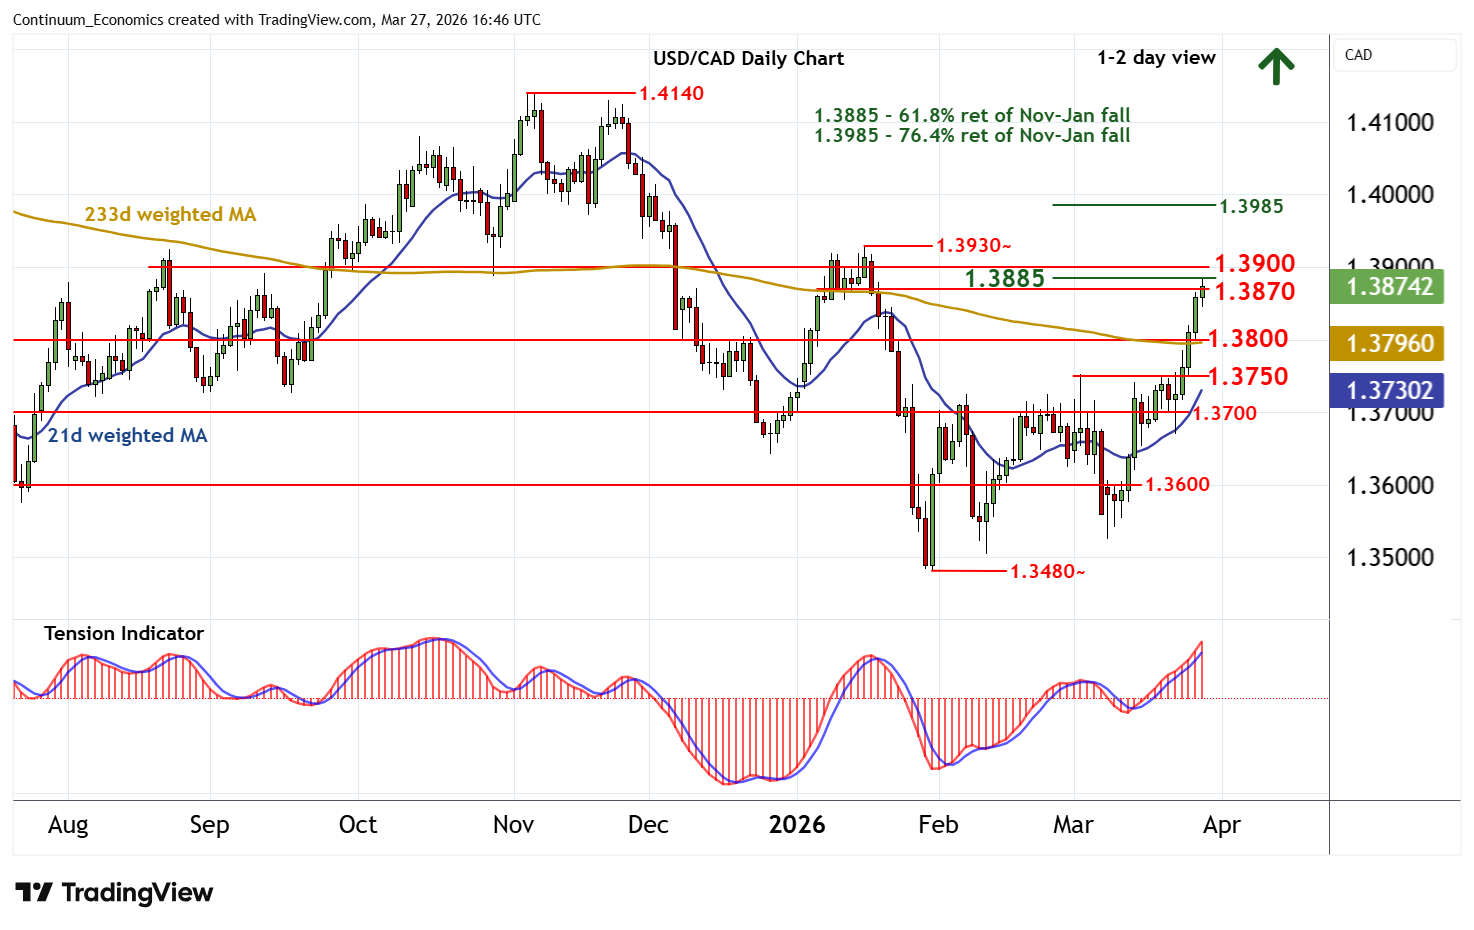
| R4 | 1.3930~ | ** | 16 Jan YTD high | S1 | 1.3800 | * | congestion | |
| R3 | 1.3900 | * | congestion | S2 | 1.3750 | * | break level | |
| R2 | 1.3885 | ** | 61.8% ret of Nov-Jan fall | S3 | 1.3700 | * | congestion | |
| R1 | 1.3870 | * | congestion lows | S4 | 1.3650 | congestion |
Asterisk denotes strength of level
16:30 GMT - Cautious trade has given way to anticipated gains, with prices currently testing strong resistance within the 1.3870 - 1.3900 range. Mixed intraday studies and flat overbought daily stochastics could limit any initial tests in renewed consolidation, before the positive daily Tension Indicator and rising weekly charts prompt a break. This would extend January gains towards the 1.3930~ current year high of 16 January. Meanwhile, support remains at congestion around 1.3800. Any immediate tests beneath here should be limited in renewed buying interest above 1.3750.