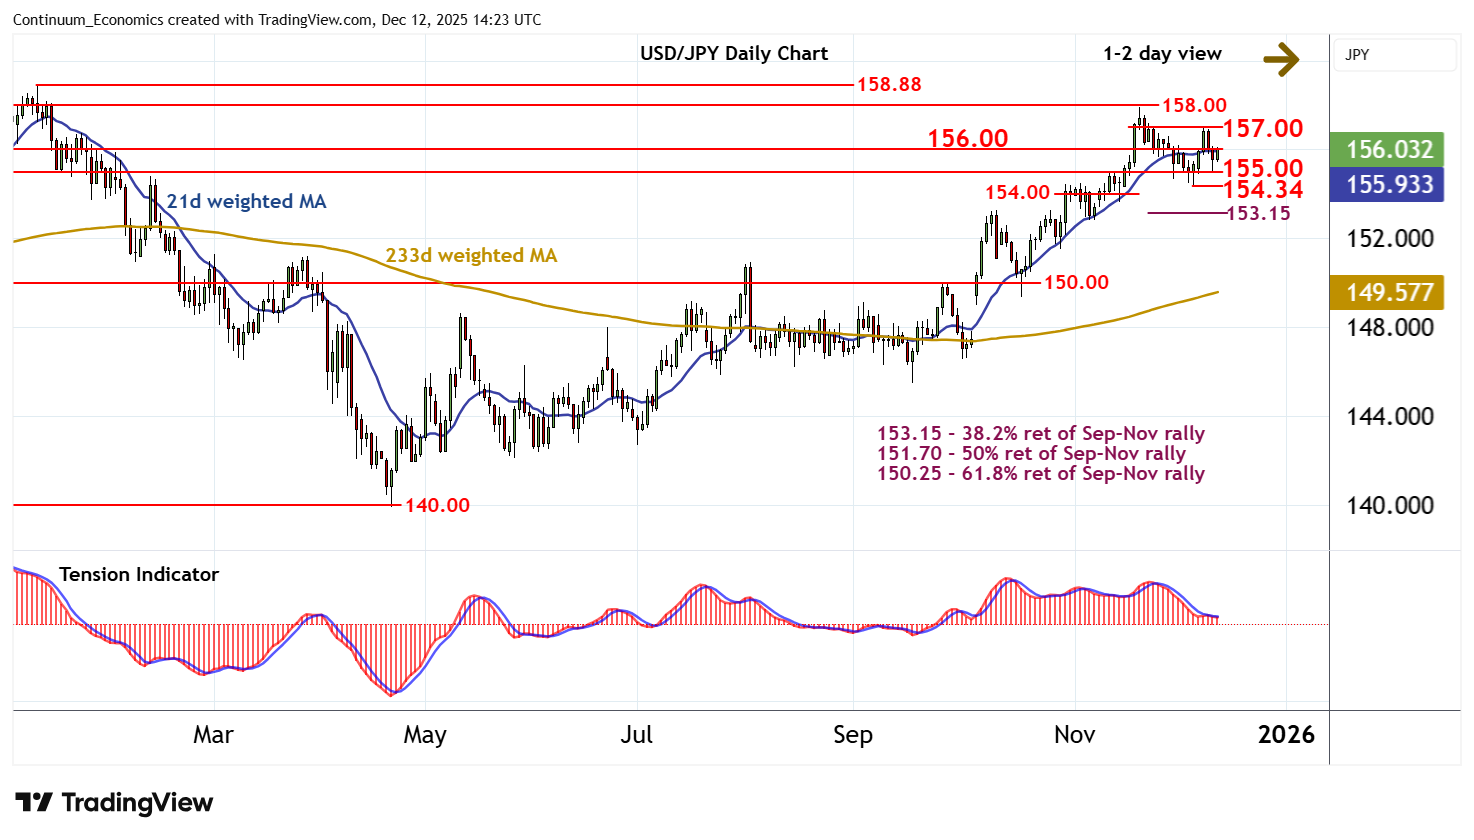
Chart USD/JPY Update: Cautious trade - studies under pressure
The test of support at the 155.00 break level has given way to a JPY-driven bounce
| Levels | Imp | Comment | Levels | Imp | Comment | |||
|---|---|---|---|---|---|---|---|---|
| R4 | 158.88 | ** | 10 Jan YTD high | S1 | 155.00 | * | break level | |
| R3 | 157.90/00 | * | 20 Nov (m) high; break level | S2 | 154.34 | * | 5 Dec (w) low | |
| R2 | 157.00 | minor congestion | S3 | 154.00 | * | break level | ||
| R1 | 156.00 | * | congestion | S4 | 153.15 | ** | 38.2% ret of Sep-Nov rally |
Asterisk denotes strength of level
14:05 GMT - The test of support at the 155.00 break level has given way to a JPY-driven bounce, with prices currently pressuring congestion resistance at 156.00. Rising intraday studies highlight potential for a test above here. But negative daily readings and deteriorating weekly charts should limit scope in renewed selling interest/consolidation beneath congestion resistance at 157.00. Following cautious/corrective trade, fresh losses are looked for. A break below 155.00 will add weight to sentiment and open up the 154.34 weekly low of 5 December. A further close beneath here will confirm continuation of late-November losses, as 154.00 then attracts, ahead of the 153.15 Fibonacci retracement.