Published: 2026-03-13T01:44:45.000Z
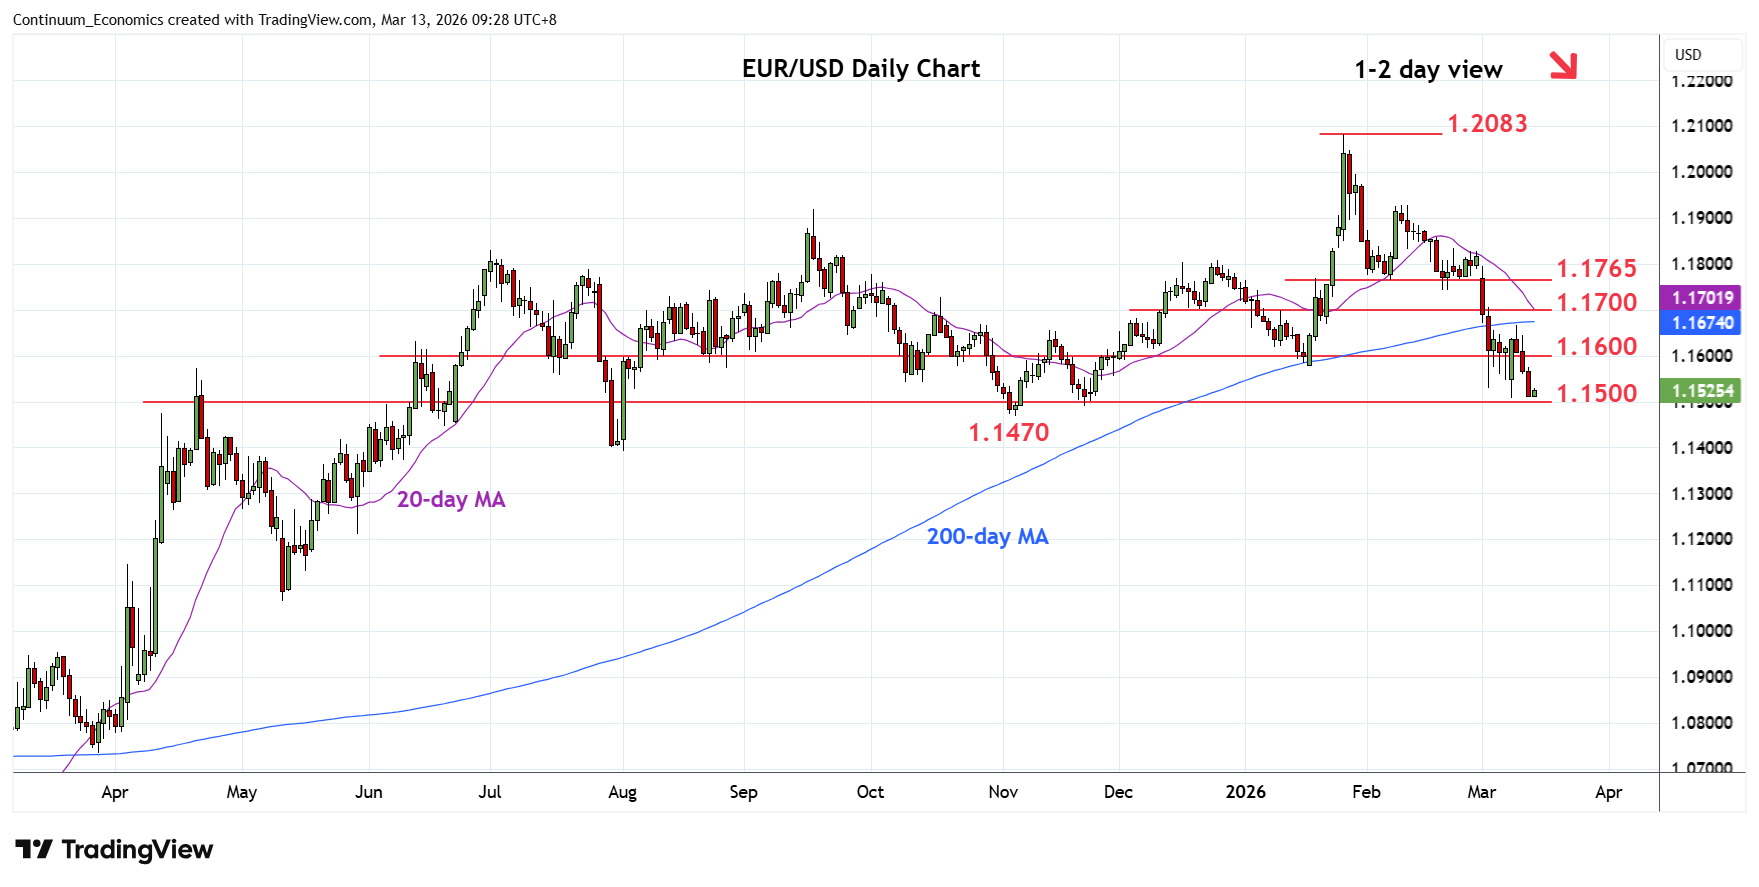
Chart EUR/USD Update: Retest 1.1507 low, break in focus
-
Met with selling pressure at the 200-day MA with losses back to retest Monday's 1.1507 current year low
| Levels | Imp | Comment | Levels | Imp | Comment | |||
|---|---|---|---|---|---|---|---|---|
| R4 | 1.1765 | ** | 6 Feb low | S1 | 1.1507 | ** | 9 Mar YTD low | |
| 14 | 1.1700 | * | congestion | S2 | 1.1470 | ** | Nov low | |
| R2 | 1.1667 | * | 10 Mar high | S3 | 1.1400 | * | congestion | |
| R1 | 1.1600 | * | congestion | S4 | 1.1355 | * | 38.2% 2025/Jan rally |
Asterisk denotes strength of level
01:30 GMT - Met with selling pressure at the 200-day MA with losses back to retest Monday's 1.1507 current year low. Consolidation here see prices unwinding oversold intraday studies but a later break cannot be ruled out to further retrace gains from the low of January 2025 year low. Break will open up room for extension to support at the 1.1470 November low and 1.1400 congestion. Meanwhile, resistance at the 1.1600 level and extending to the 1.1667 Tuesday's bounce high now expected to cap and sustain losses from the 1.2083, January YTD high.