Published: 2026-02-20T01:47:51.000Z
Chart EUR/USD Update: Extending January losses
4
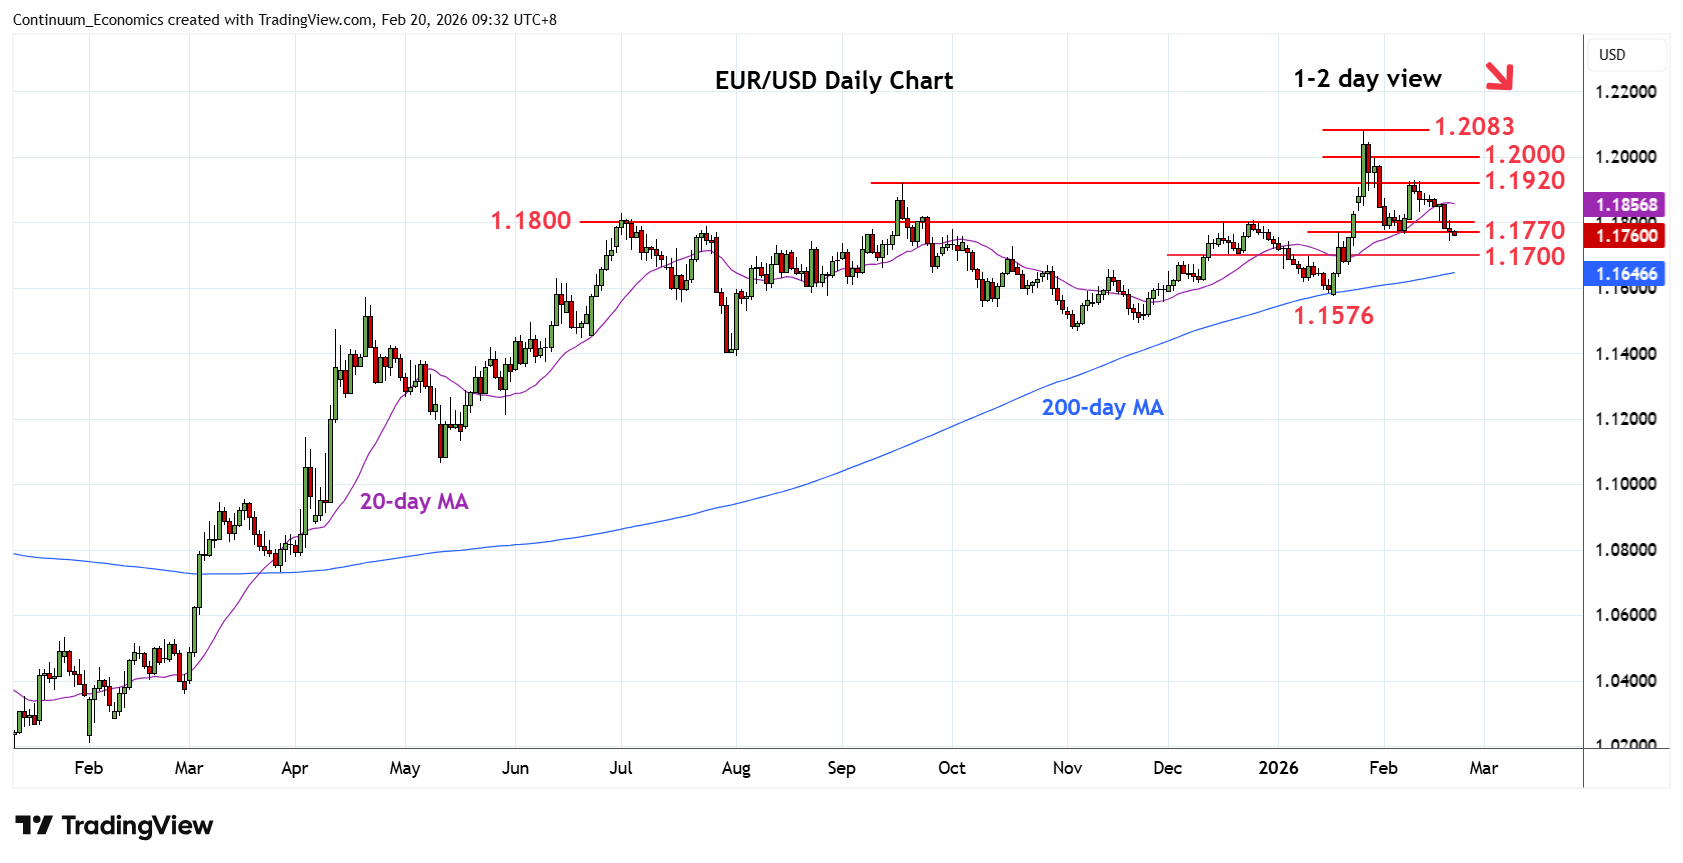
Prices remain under pressure and break of the 1.1770 support see prices extending losses from the 1.2083, January current year high
| Levels | Imp | Comment | Levels | Imp | Comment | |||
|---|---|---|---|---|---|---|---|---|
| R4 | 1.2000 | * | congestion | S1 | 1.1700 | * | congestion | |
| 14 | 1.1900/20 | ** | congestion, 2025 yr high | S2 | 1.1650 | * | congestion | |
| R2 | 1.1850 | * | congestion | S3 | 1.1600 | * | congestion | |
| R1 | 1.1800 | * | congestion | S4 | 1.1576 | ** | 19 Jan YTD low |
Asterisk denotes strength of level
01:40 GMT - Prices remain under pressure and break of the 1.1770 support see prices extending losses from the 1.2083, January current year high. Lower will see room to the 1.1700 and 1.1650 congestion. Below these will turn focus to the strong support at 1.1600/1.1576, congestion and 19 January YTD low. Meanwhile, resistance at the 1.1830/50 July high and congestion area is expected to cap. Regaining this will ease the downside pressure and expose strong resistance at the 1.1900/20 level and September 2025 year high to retest.