Continuum Economics
  • Search
  • About Us
  • Buy
  • Invite A Friend
  • My Basket
  • Articles
  • Calendar
  • Forecasts
  • Events
  • Data
  • Newsletters
  • My Alerts
  • Community
  • Directory
  • About Us
  • Buy
  • Invite A Friend
  • My Basket
  • Articles
    • All
    • Thematic
    • Tactical
    • Asia
    • EMEA
    • Americas
    • Newsletters
    • Freemium
    • Editor's Choice
    • Most Viewed
    • Most Shared
    • Most Liked
  • Calendar
    • Interactive
      • China
      • United States
      • Eurozone
      • United Kingdom
    • Month Ahead
    • Reviews
    • Previews
  • Forecasts
    • Forecasts
    • Key Views
  • Events
    • Media
    • Conference Calls
  • Data
    • Country Insights
    • Shadow Credit Ratings
    • Full CI Data Download
  • Newsletters
  • My Alerts
  • Community
    • FX
    • Fixed Income
    • Macro Strategy
    • Credit Markets
    • Equities
    • Commodities
    • Precious Metals
    • Renewables
  • Directory
  • My Account
  • Notifications Setup
  • Administration Panel
  • Account Details
  • Recent Devices
  • Distribution Lists
  • Shared Free Trials
  • Saved Articles
  • Shared Alerts
  • My Posts
Published: 2025-08-11T11:40:28.000Z

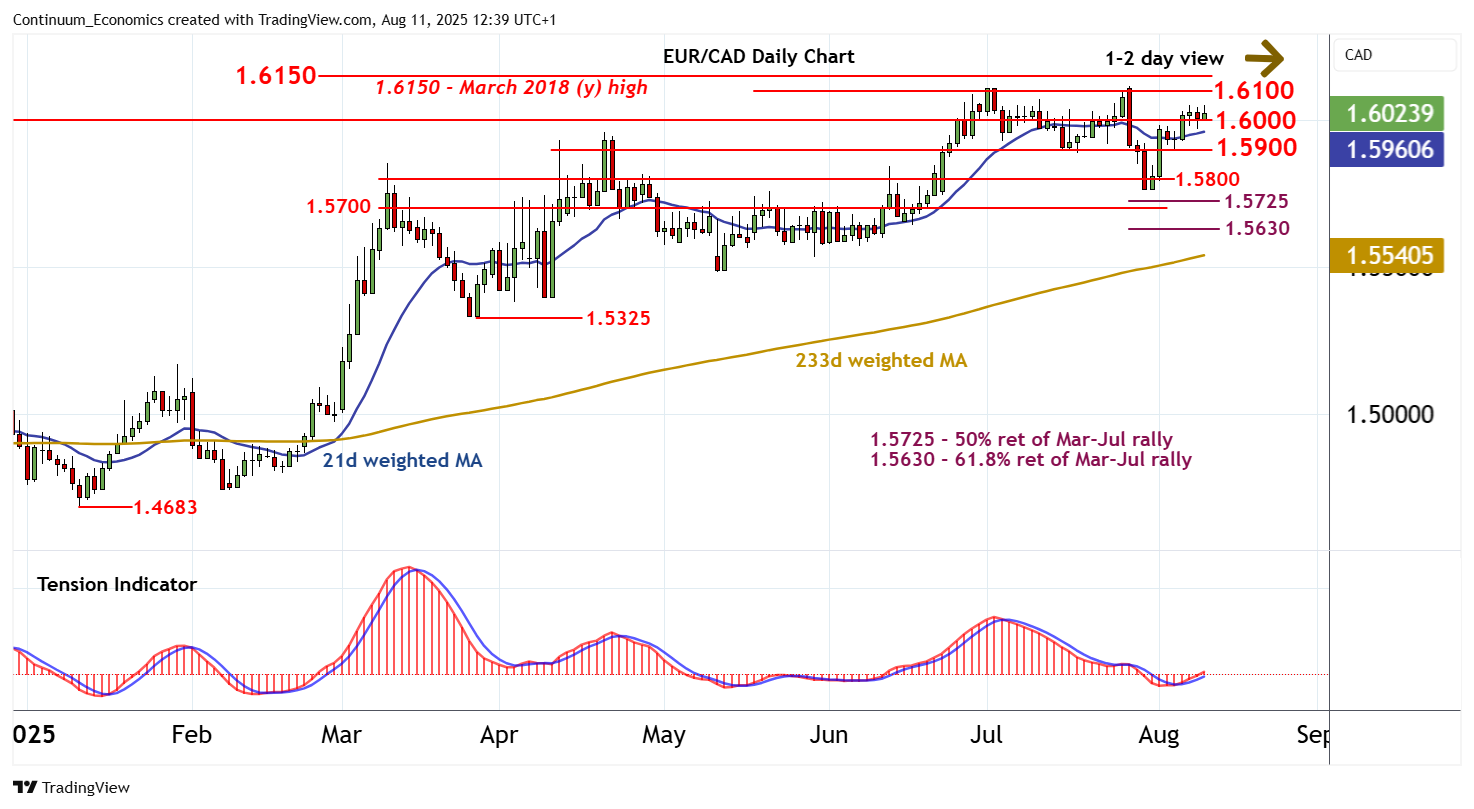
Chart EUR/CAD Update: Consolidating - studies leaning lower

byMike Macdonald

Senior Technical Strategist
-

Little change, as prices extend cautious trade above congestion support at 1.6000

 Level Comment  Level Comment
R41.6235**76.4% ret of 2008-2012 fall S11.6000**congestion
R31.6150~**March 2018 (y) high S21.5900 congestion
R21.6100/18**cong; 28 Jul YTD high S31.5800 congestion
R11.6050~ 7 Aug high S41.5765~ 30 Jul low

Asterisk denotes strength

12:05 BST - Little change, as prices extend cautious trade above congestion support at 1.6000. Intraday studies are leaning lower and rising daily stochastics are flattening, suggesting potential for a test. But the rising daily Tension Indicator is expected to limit any initial break in fresh consolidation above further congestion around 1.5900, before negative weekly charts prompt deeper losses. Meanwhile, resistance is up to congestion around 1.6100 and the 1.6118 current year high of 28 July. This range should cap any immediate tests higher.

Continue to read the article for free
Login

or

or

Topics
EUR/CAD-TA
Technical Analysis
DM-Technical

GENERAL

  • Home
  • About Us
  • Our Team
  • Careers

LEGAL

  • Terms and Conditions
  • Privacy Policy
  • Compliance
  • GDPR

GET IN TOUCH

  • Contact Us
Continuum Economics
The Technical Analyst Awards Winner 2021
The Technical Analyst Awards Finalist 2020
image