Published: 2026-03-17T01:37:29.000Z
Chart EUR/USD Update: Higher in range from 1.1410 current year low
2
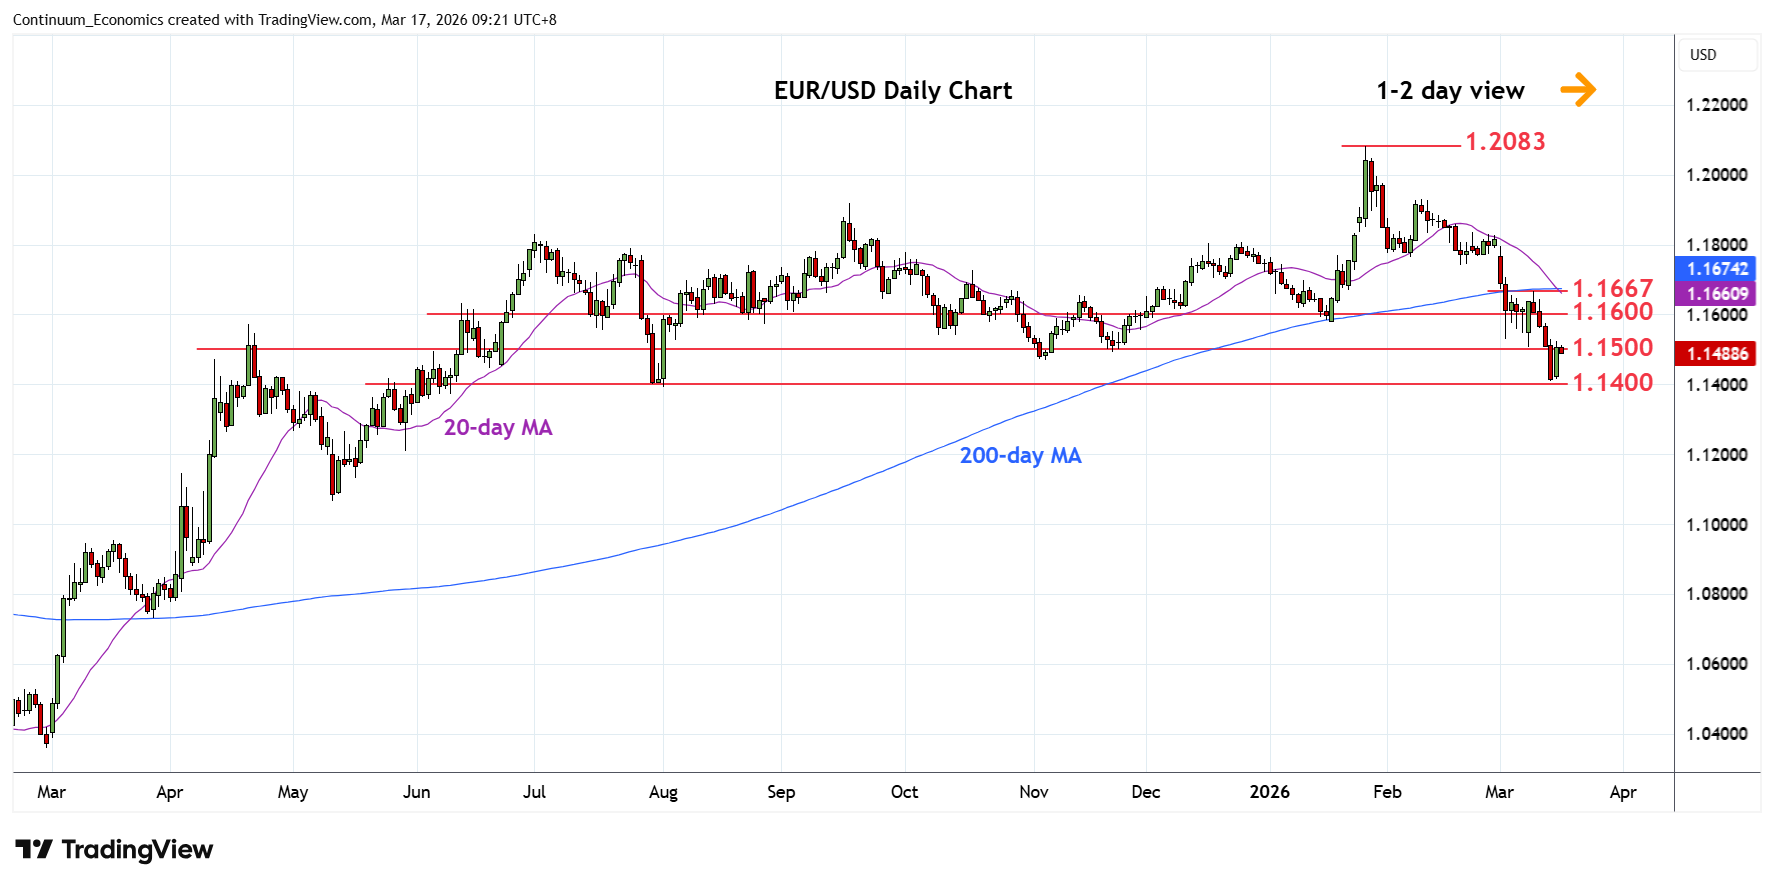
Turned up in range from fresh year low at 1.1410 as prices unwind oversold intraday and daily studies
| Levels | Imp | Comment | Levels | Imp | Comment | |||
|---|---|---|---|---|---|---|---|---|
| R4 | 1.1700 | * | congestion | S1 | 1.1455 | intraday congestion | ||
| 14 | 1.1667 | ** | 10 Mar high | S2 | 1.1410 | ** | 13 Mar YTD low | |
| R2 | 1.1600 | * | congestion | S3 | 1.1355 | * | 38.2% 2025/Jan rally | |
| R1 | 1.1500/30 | * | congestion, 3 Mar low | S4 | 1.1275/00 | ** | 2023/2024 year highs |
Asterisk denotes strength of level
01:30 GMT - Turned up in range from fresh year low at 1.1410 as prices unwind oversold intraday and daily studies to reach the 1.1500/30 resistance. Would take break here to open up room for stronger bounce to the retest the 1.1600 level. Clearance here, if seen, will expose strong resistance at the 1.1667 high which is expected to cap. Meanwhile, support is raised to 1.1455 intraday congestion. Below this will expose the 1.1410 low to retest and see room to extend losses from the 1.2083 January current year high to 1.1355, 38.2% Fibonacci level.