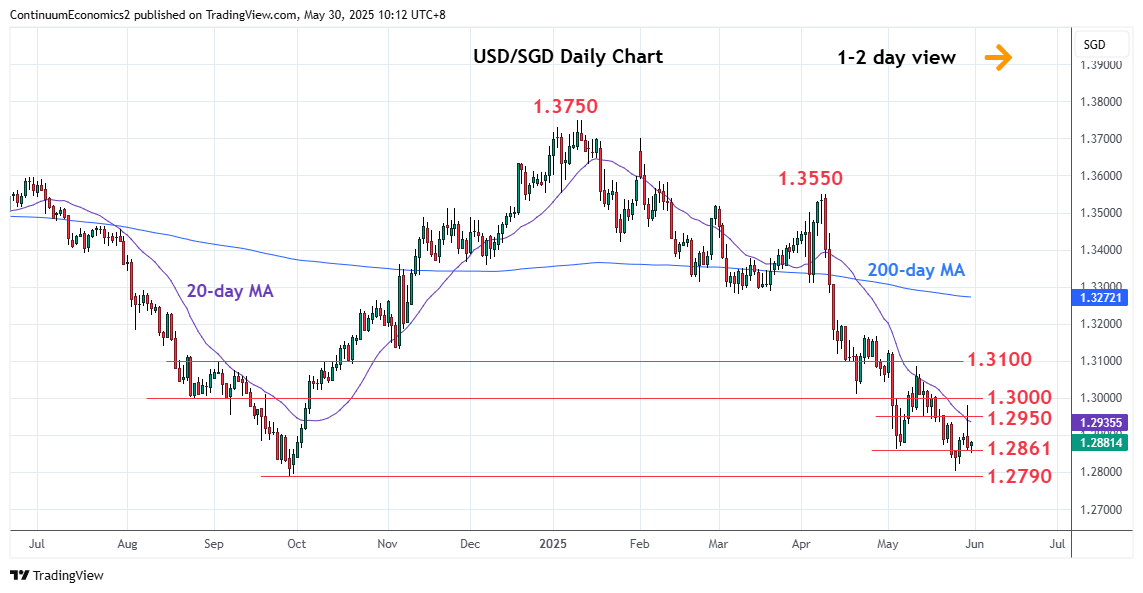
Chart USD/SGD Update: Weighing on 1.2861 support

No follow-through on break above resistance at 1.2950 congestion and rejection from 1.2980 high see the resulting pin bar weighing
| Level | Comment | Level | Comment | ||||
|---|---|---|---|---|---|---|---|
| R4 | 1.3169 | * | 23 Apr high | S1 | 1.2861 | * | 5 May low |
| R3 | 1.3086 | ** | 12 May high | S2 | 1.2800 | ** | 26 May YTD low |
| R2 | 1.3000/10 | ** | congestion, Apr low | S3 | 1.2790 | ** | Sep 2024 multi-year low |
| R1 | 1.2950 | * | congestion | S4 | 1.2700 | * | congestion from Oct 2014 |
Asterisk denotes strength of level
02:25 GMT - No follow-through on break above resistance at 1.2950 congestion and rejection from 1.2980 high see the resulting pin bar returning to pressure 1.2861 support. Below this will see return to the critical support at 1.2800 low and 1.2790, September 2024 multi-year low. This area is expected to keep losses in check and extend consolidation here. Break here, will further extend losses from the March 2020 year high. Meanwhile, resistance at 1.2950/1.3000 congestion is expected to cap. Would take break here to open up room for stronger corrective bounce to retrace January/May losses.