Published: 2026-04-08T02:09:08.000Z
Chart GBP/USD Update: Extending sharp rally
1
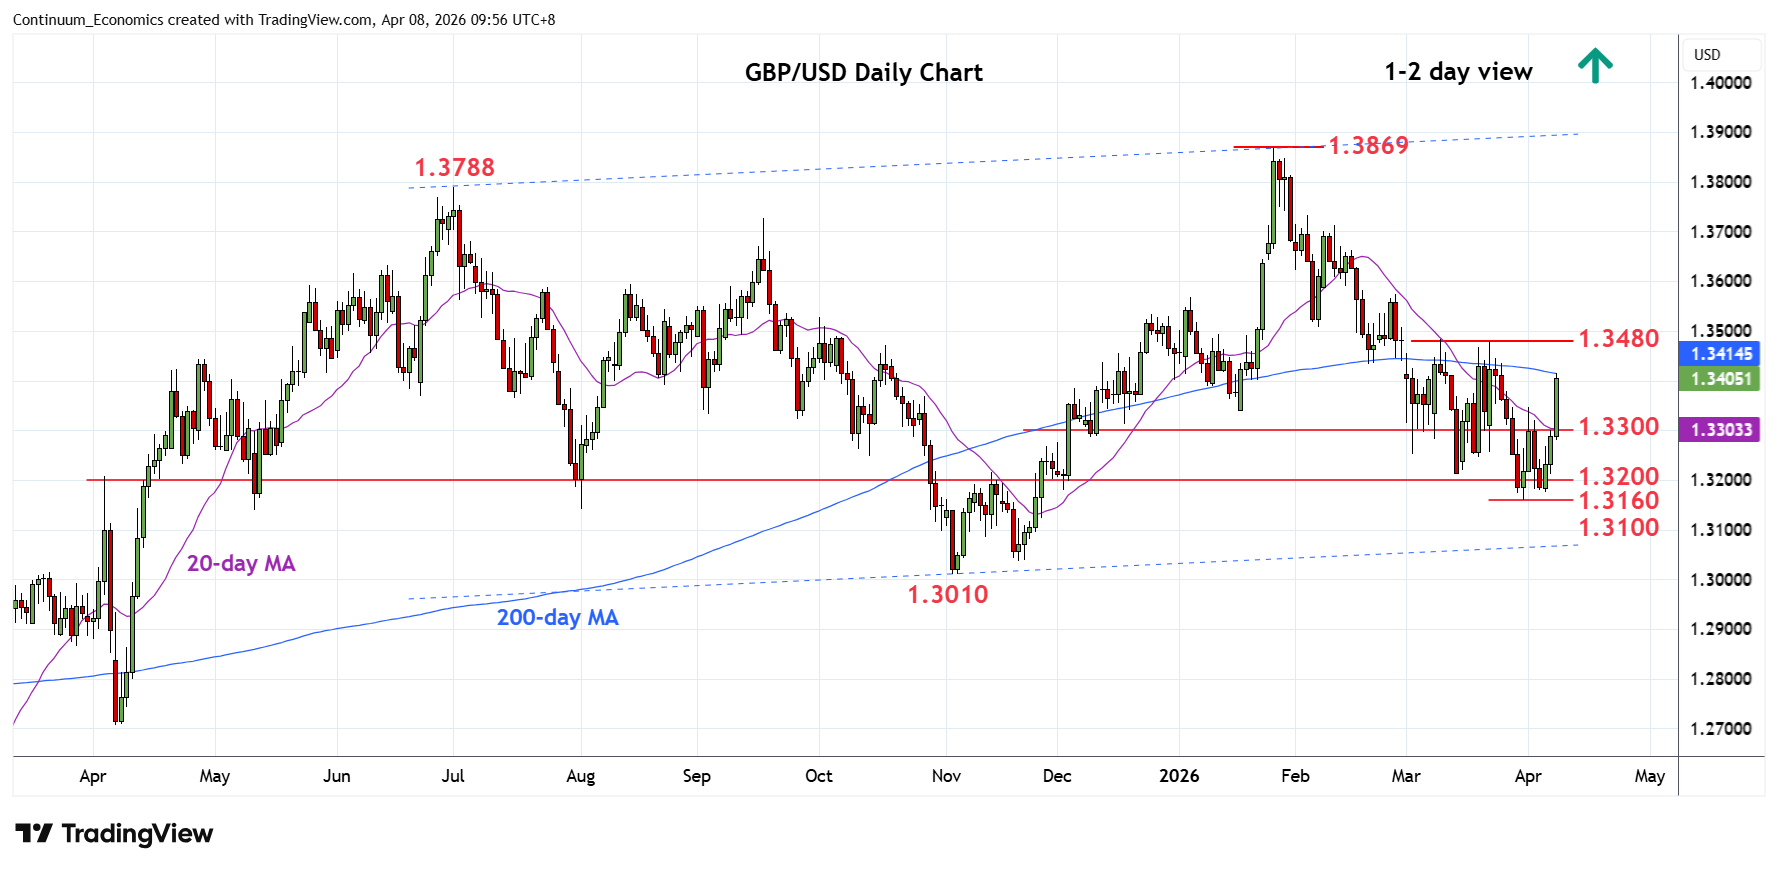
Consolidation above the 1.3160/75 lows has given way to sharp bounce through the 1.3300 level to reach 1.3400/15 level and 200-day MA
| Level | Comment | Level | Comment | |||||
|---|---|---|---|---|---|---|---|---|
| R4 | 1.3575 | 26 Feb high | S1 | 1.3350 | congestion | |||
| R3 | 1.3500/10 | ** | congestion, 6 Feb low | S2 | 1.3300 | * | congestion | |
| R2 | 1.3480 | ** | Mar high | S3 | 1.3250 | * | congestion | |
| R1 | 1.3400/15 | * | congestion, 200-day MA | S4 | 1.3210/00 | * | 13 Mar low, congestion |
Asterisk denotes strength of level
02:00 GMT - Consolidation above the 1.3160/75 lows has given way to sharp bounce through the 1.3300 level to reach 1.3400/15 level and 200-day MA. Positive daily and weekly studies suggest consolidation here giving way to renewed buying interest to open up room for stronger gains to retrace losses from the January high. Higher will see room to the strong resistance at the 1.3480 March high and 1.3500/10 area. Meanwhile, support is raised to the 1.3350/1.3300 congestion area which should underpin and sustain gains from the 1.3160, 31 March current year low.