Chart GBP/USD Update: Leaning lower
Cautious trade has given way to renewed selling pressure
| Level | Comment | Level | Comment | |||||
|---|---|---|---|---|---|---|---|---|
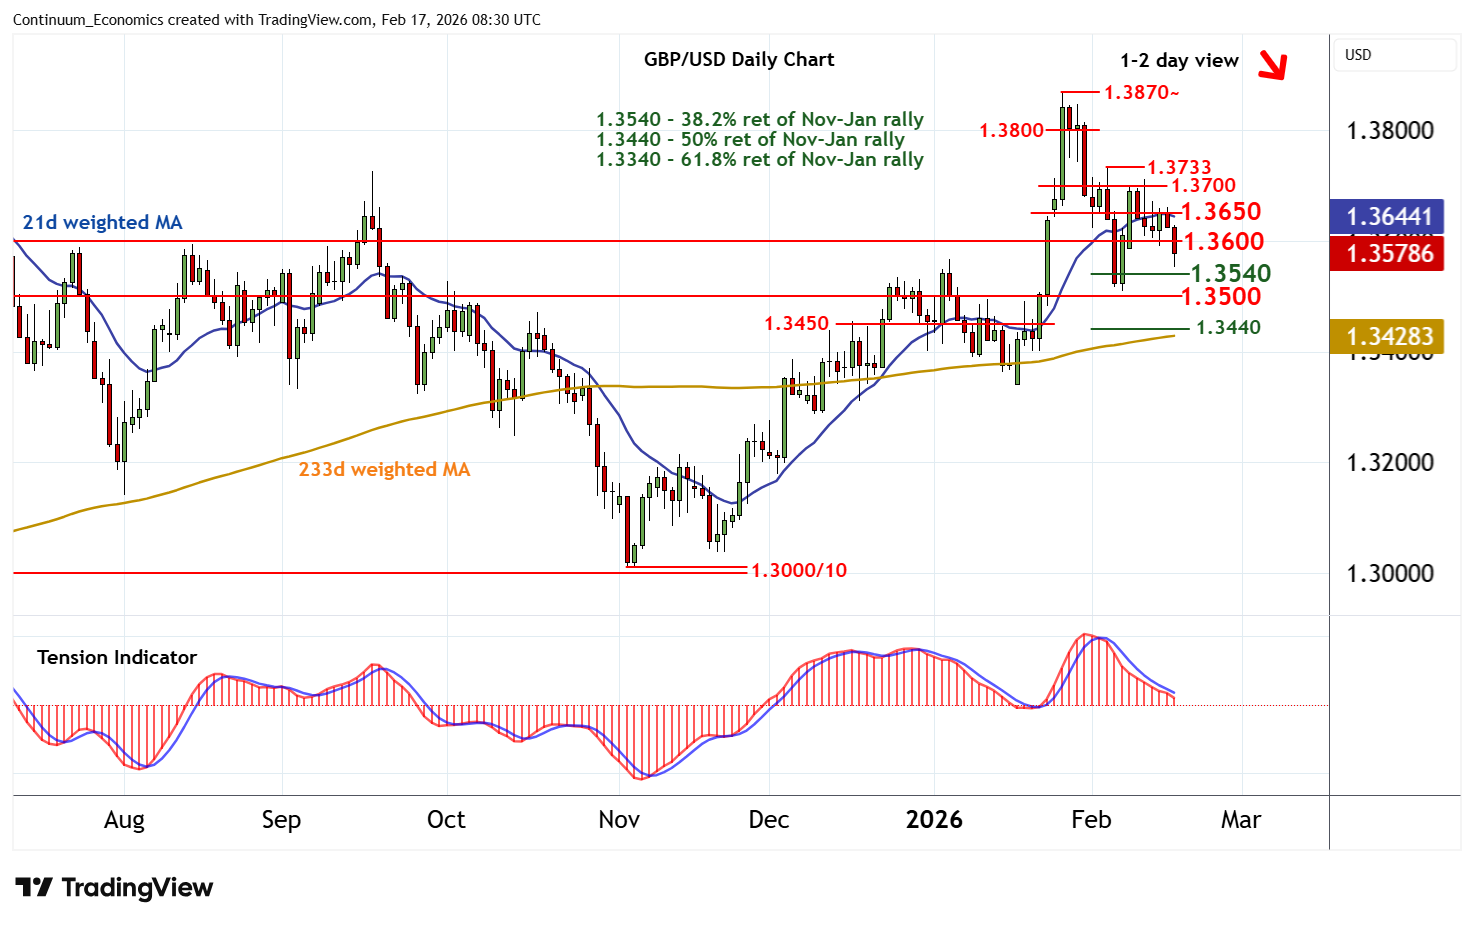
| R4 | 1.3733 | * | 4 Feb (w) high | S1 | 1.3540 | * | 38.2% ret of Nov-Jan rally | |
| R3 | 1.3700 | break level | S2 | 1.3500/10~ | ** | congestion; 6 Feb (w) low | ||
| R2 | 1.3650 | * | break level | S3 | 1.3440/50 | ** | 50% ret; congestion | |
| R1 | 1.3600 | * | congestion | S4 | 1.3400 | ** | congestion |
Asterisk denotes strength of level
08:10 GMT - Cautious trade has given way to renewed selling pressure, as intraday studies turn down, with prices currently trading around 1.3575. Focus is on the 1.3540 Fibonacci retracement, but deteriorating daily readings and a tick lower in broader weekly charts highlights room for a further break. Beneath here is 1.3500/10~. A close beneath here will turn sentiment negative and confirm continuation of late-January losses, as increased selling pressure opens up a test of the 1.3440/50 range. Meanwhile, resistance is lowered to congestion around 1.3600. A close above here is needed to help stabilise price action once again and prompt consolidation beneath 1.3650.