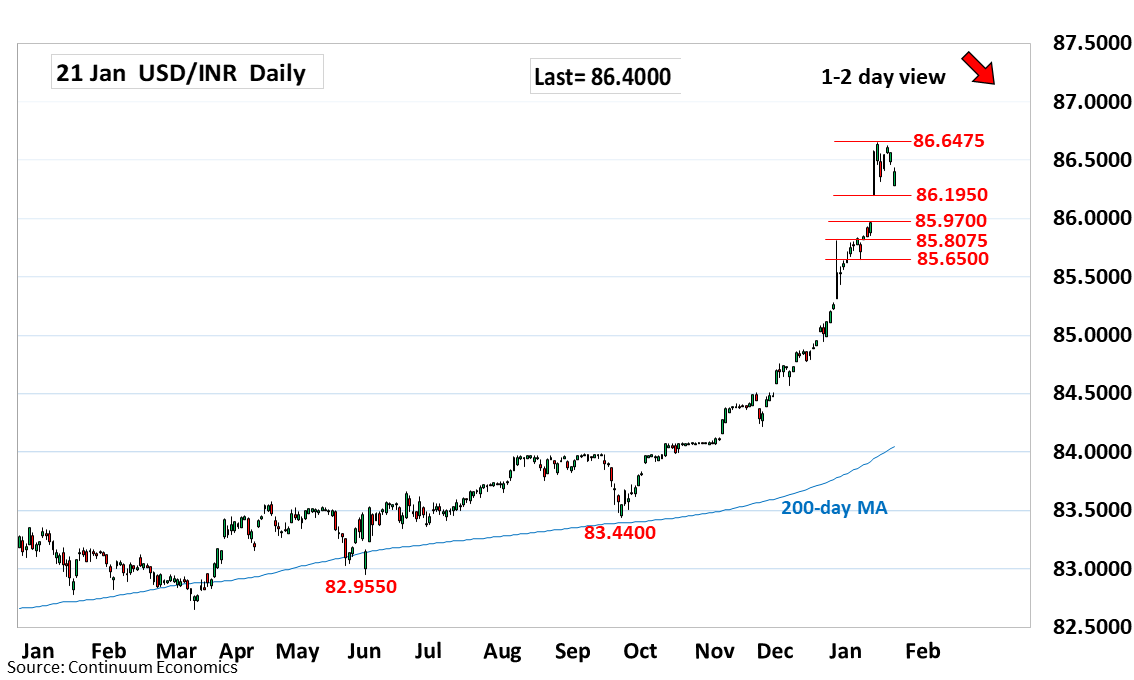
Extending pullback from the 86.6475 all-time high and break of the 86.3125 support see the 86.1950/85.9700 gap area now attracting

| Level | Comment | Level | Comment | |||||
|---|---|---|---|---|---|---|---|---|
| R4 | 86.7500 | * | projection | S1 | 86.1950 | * | 13 Jan low | |
| R3 | 86.6475 | ** | 14 Jan all-time high | S2 | 85.9700 | ** | 10 Jan high, gap | |
| R2 | 86.6225 | * | 17 Jan high | S3 | 85.8400 | * | 6 Jan high | |
| R1 | 86.4600 | * | 20 Jan low | S4 | 85.8075 | ** | Dec high |
Asterisk denotes strength of level
05:30 GMT - Extending pullback from the 86.6475 all-time high and break of the 86.3125 support see the 86.1950/85.9700 gap area now attracting. Daily studies have turned down from overbought areas and caution pullback to fill this gap. Below this will confirm a top in place at the 86.6475 high and see room for deeper pullback to retrace strong rally from the September low. Meanwhile, resistance is lowered to 86.4600 low of Monday and this should sustain losses from the 86.6225 and 6.6475 highs.