Continuum Economics
  • Search
  • About Us
  • Buy
  • Invite A Friend
  • My Basket
  • Articles
  • Calendar
  • Forecasts
  • Events
  • Data
  • Newsletters
  • My Alerts
  • Community
  • Directory
  • About Us
  • Buy
  • Invite A Friend
  • My Basket
  • Articles
    • All
    • Thematic
    • Tactical
    • Asia
    • EMEA
    • Americas
    • Newsletters
    • Freemium
    • Editor's Choice
    • Most Viewed
    • Most Shared
    • Most Liked
  • Calendar
    • Interactive
      • China
      • United States
      • Eurozone
      • United Kingdom
    • Month Ahead
    • Reviews
    • Previews
  • Forecasts
    • Forecasts
    • Key Views
  • Events
    • Media
    • Conference Calls
  • Data
    • Country Insights
    • Shadow Credit Ratings
    • Full CI Data Download
  • Newsletters
  • My Alerts
  • Community
    • FX
    • Fixed Income
    • Macro Strategy
    • Credit Markets
    • Equities
    • Commodities
    • Precious Metals
    • Renewables
  • Directory
  • My Account
  • Notifications Setup
  • Administration Panel
  • Account Details
  • Recent Devices
  • Distribution Lists
  • Shared Free Trials
  • Saved Articles
  • Shared Alerts
  • My Posts
Published: 2025-12-15T13:18:46.000Z

Chartbook: Chart GBP/USD: Range trade - long-term studies rising

3

The pullback from the 1.3790 current year high of 1 July has extended to strong congestion support at 1.3000

The pullback from the 1.3790 current year high of 1 July has extended to strong congestion support at 1.3000,

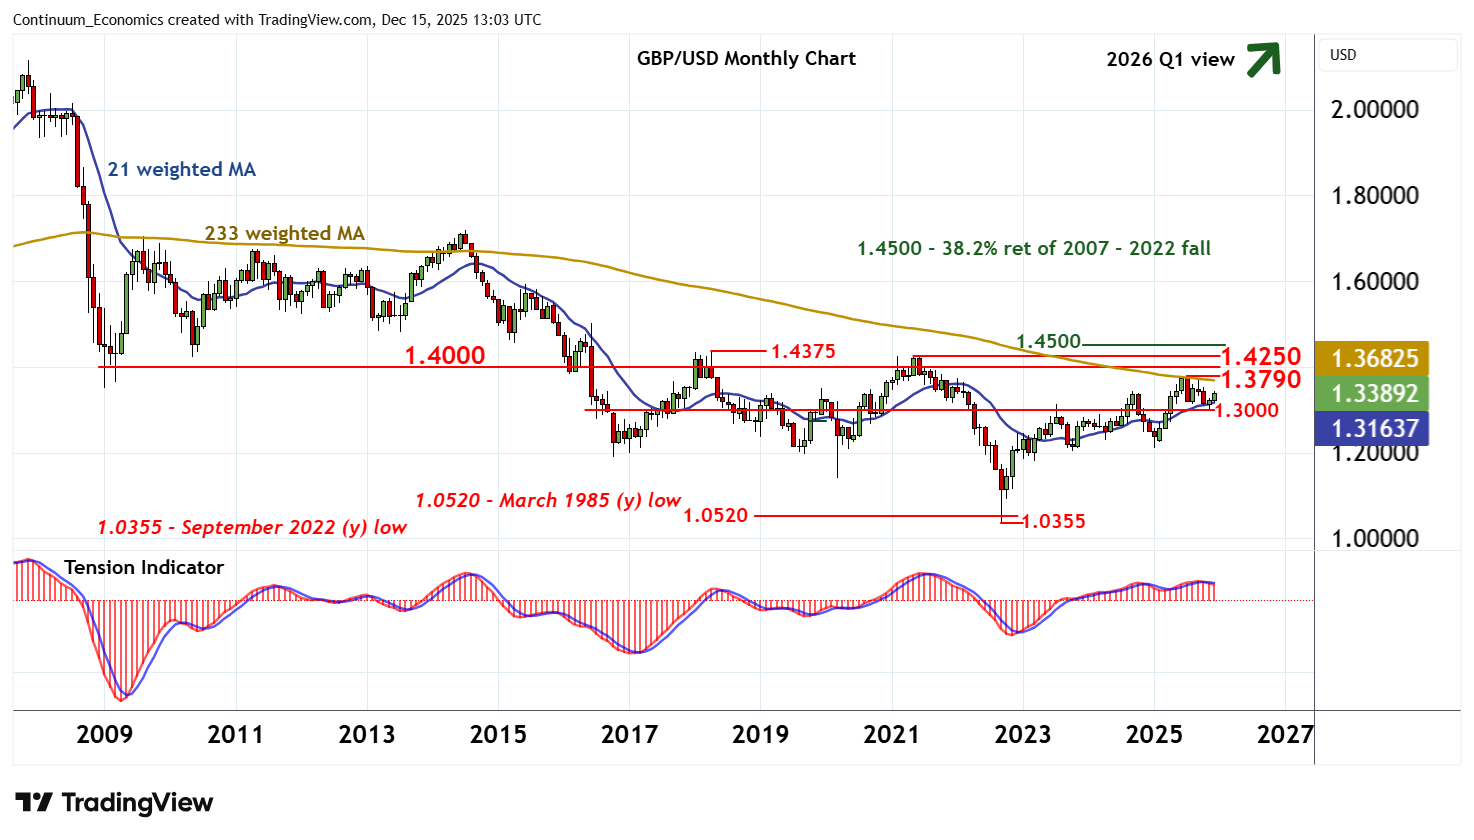
where a fresh bounce is developing.

Immediate focus is on congestion around 1.3500. But falling monthly stochastics and a tick lower in the monthly Tension Indicator are expected to limit any immediate break in fresh consolidation beneath 1.3790.

Longer-term charts continue to improve, however, pointing to room for further gains in the coming months.

A close above 1.3790 will turn sentiment positive once again and extend gains from the 1.0355 multi-year low of September 2022 towards 1.4000.

Still higher is critical multi-year resistance within the 1.4250 year high of June 2021 and 1.4375 multi-year high of April 2018.

By-then overbought monthly stochastics could limit any initial tests of this range in consolidation/profit-taking, before improving longer-term charts prompt a break

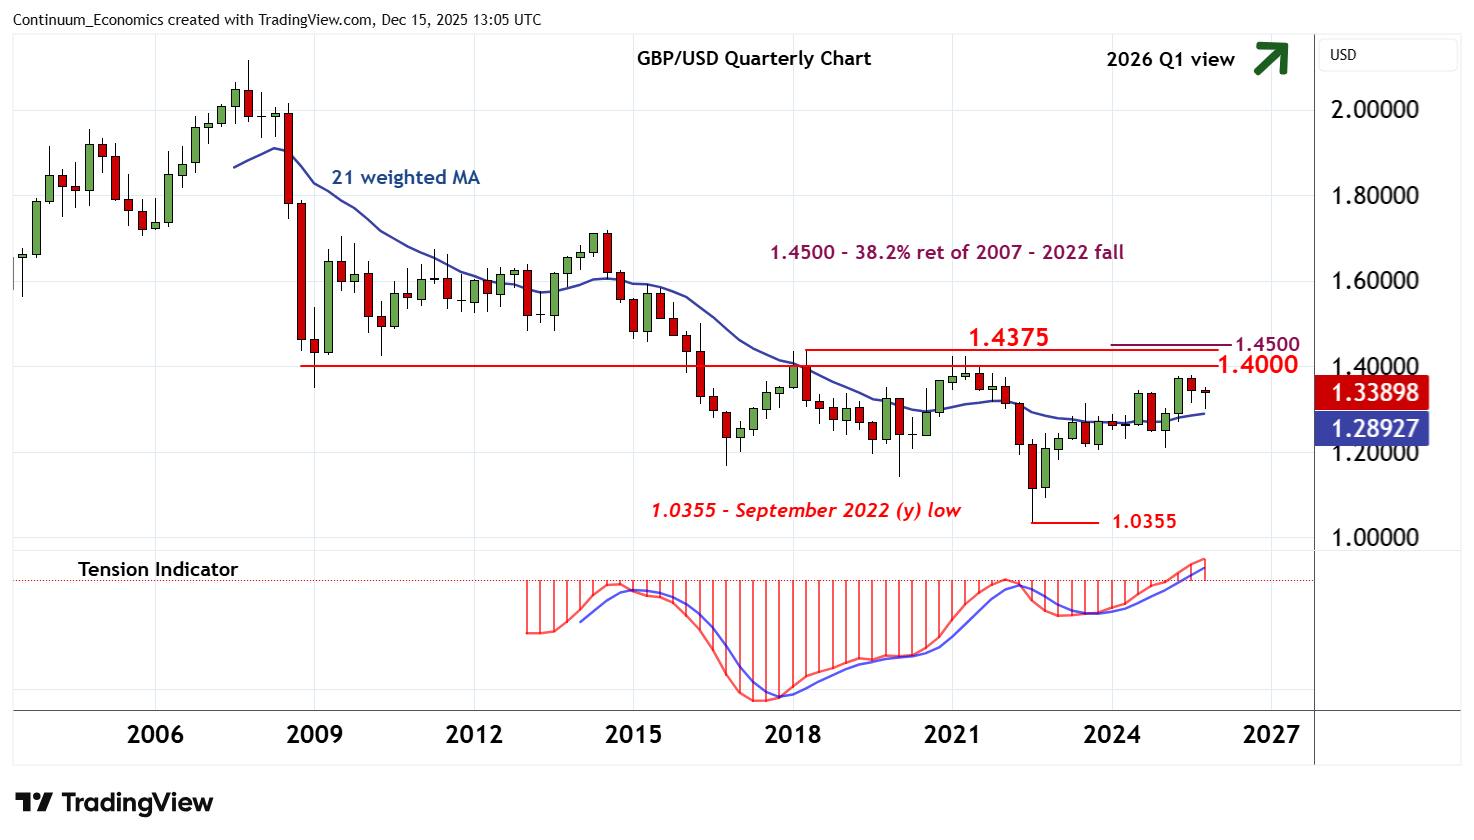
and open up the 1.4500 multi-year Fibonacci retracement.

Meanwhile, immediate support is at congestion around 1.3000 and extends to the 1.2950 Fibonacci retracement.

Rising weekly charts should limit any fresh tests of this tight range in renewed buying interest/consolidation.

A close beneath here, if seen, would confirm a significant top in place and turn sentiment negative, as deeper losses then focus initially on the 1.2750 retracement.

Continue to read the article for free
Login

or

or

Topics
Technical Analysis
GBP/USD-TA
ChartBook

GENERAL

  • Home
  • About Us
  • Our Team
  • Careers

LEGAL

  • Terms and Conditions
  • Privacy Policy
  • Compliance
  • GDPR

GET IN TOUCH

  • Contact Us
Continuum Economics
The Technical Analyst Awards Winner 2021
The Technical Analyst Awards Finalist 2020
image