Published: 2026-01-26T00:26:43.000Z
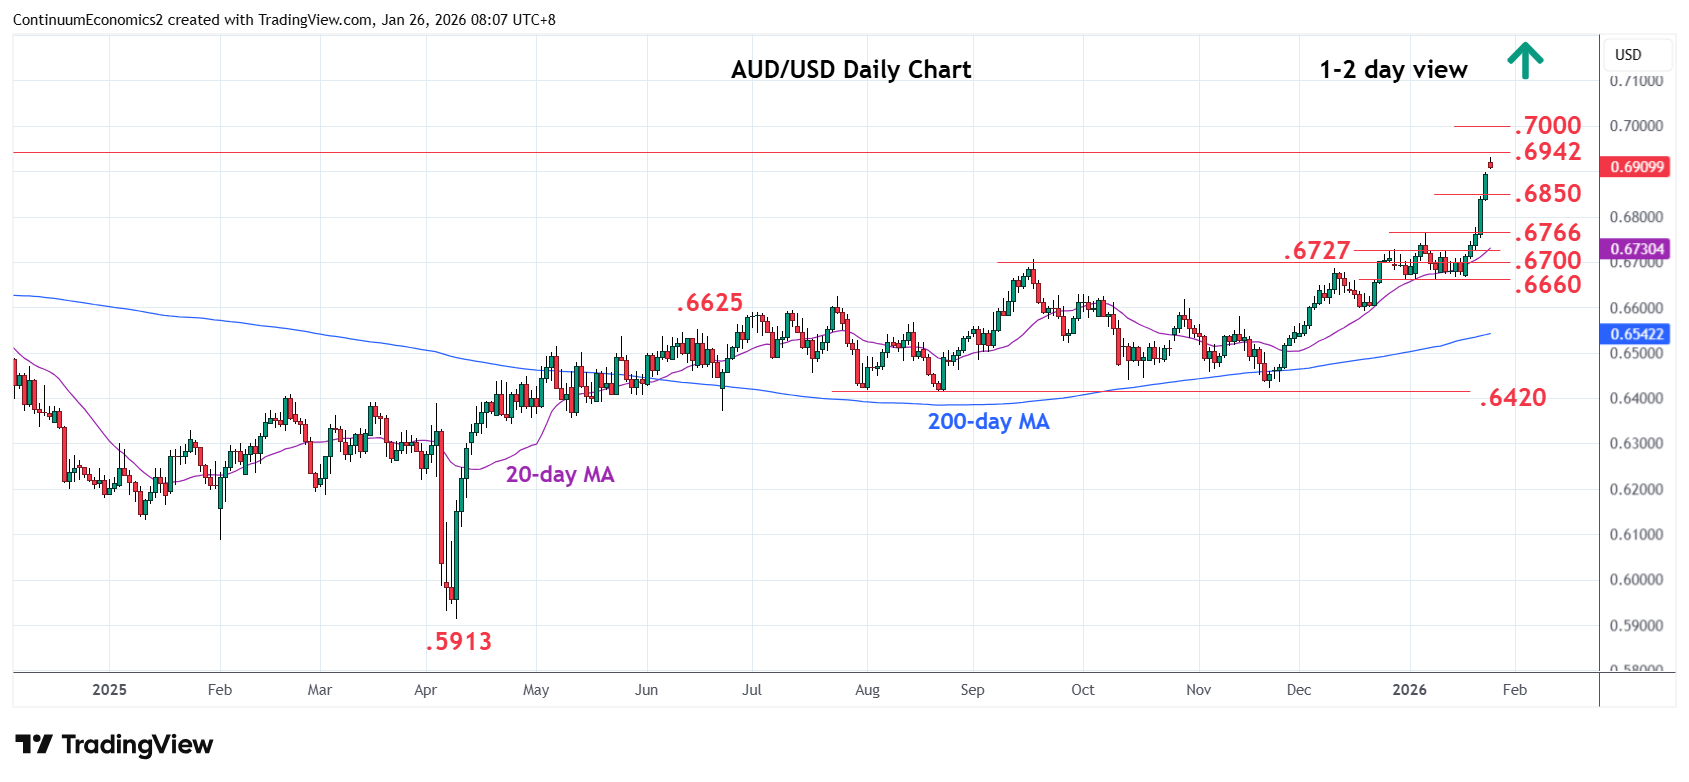
Chart AUD/USD Update: Just shy of .6942, 2024 year high
1
Extending sharp gains last week as prices gapped to fresh high at the open above the .6900 level to approach .6942, 2024 year high
| Levels | Imp | Comment | Levels | Imp | Comment | |||
|---|---|---|---|---|---|---|---|---|
| R4 | 0.7050 | congestion | S1 | 0.6850 | * | congestion | ||
| R3 | 0.7000 | ** | figure, congestion | S2 | 0.6800 | * | congestion | |
| R2 | 0.6960 | * | 50% 2021/2025 fall | S3 | 0.6766 | ** | 7 Jan high | |
| R1 | 0.6942 | ** | Sep 2024 year high | S4 | 0.6727/00 | ** | Dec, Sep highs |
Asterisk denotes strength of level
00:15 GMT - Extending sharp gains last week as prices gapped to fresh high at the open above the .6900 level to approach .6942, 2024 year high. Would expect reaction here to consolidate strong gains from the .6660 support and unwind overbought daily and weekly studies. A later break will see room to .6960, a 50% Fibonacci level, then the .7000 figure. Meanwhile, support is raised to the .6850 congestion which extend to the .6800 level. This area now expected to underpin and sustain strong gains from the recent November swing low.