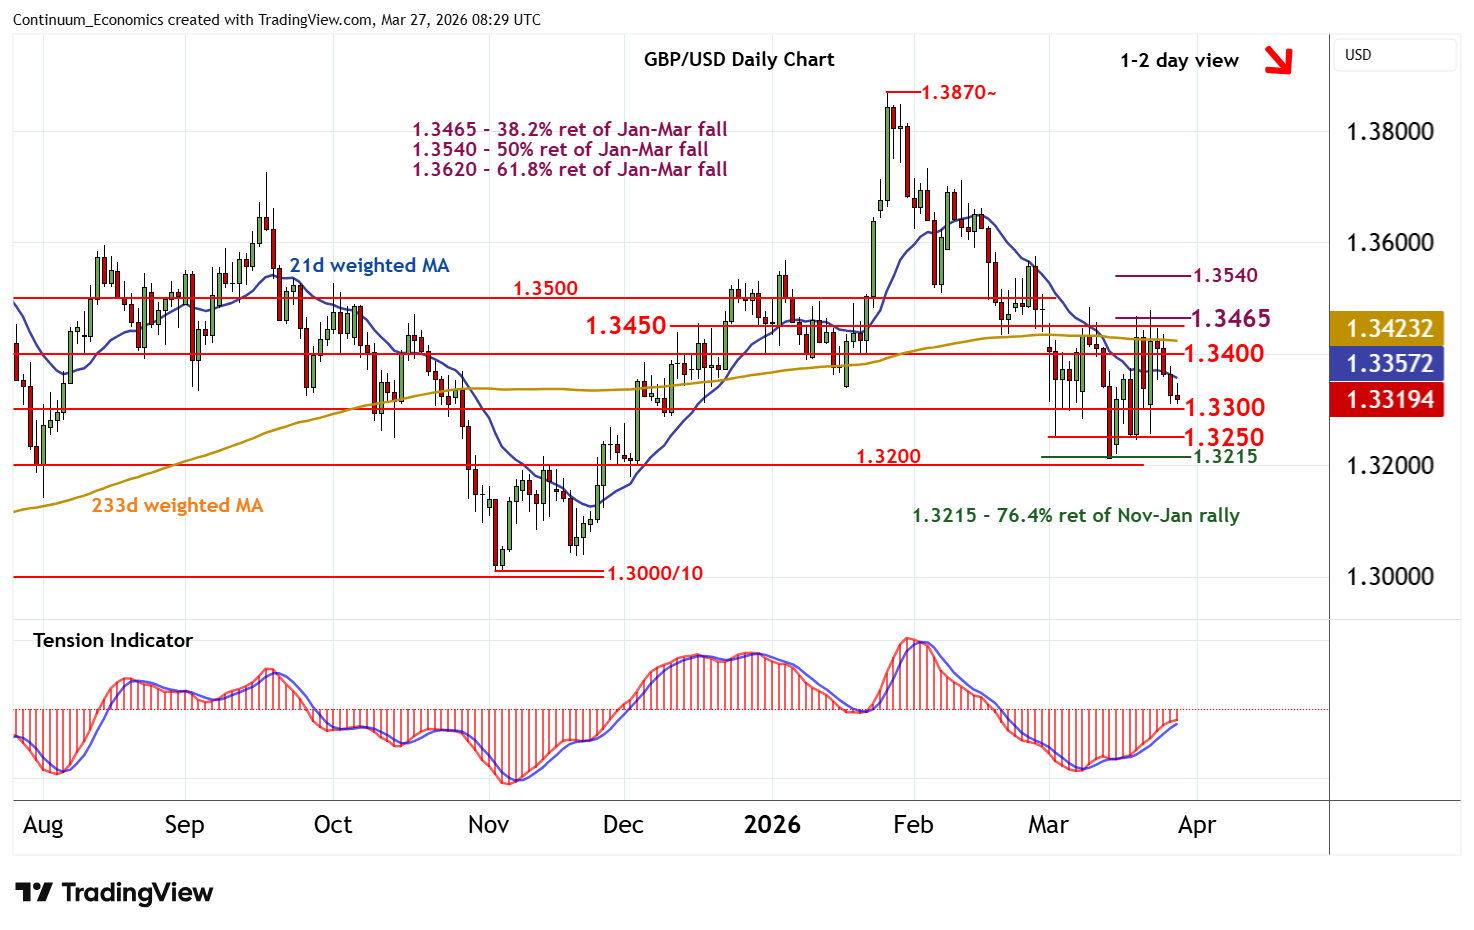
Chart GBP/USD Update: Drifting lower
Little change, as prices continue to drift lower towards congestion support at 1.3300
| Level | Comment | Level | Comment | |||||
|---|---|---|---|---|---|---|---|---|
| R4 | 1.3500 | ** | congestion | S1 | 1.3300 | * | congestion | |
| R3 | 1.3465 | * | 38.2% ret of Jan-Mar fall | S2 | 1.3250 | * | recent lows, congestion | |
| R2 | 1.3450 | ** | congestion | S3 | 1.3200/15 | ** | cong; 76.4% ret of Nov-Jan rally | |
| R1 | 1.3400 | ** | congestion | S4 | 1.3100 | * | congestion |
Asterisk denotes strength of level
08:10 GMT - Little change, as prices continue to drift lower towards congestion support at 1.3300. Overbought daily stochastics are unwinding and the positive daily Tension Indicator is flattening, suggesting room for a break beneath here towards further congestion around 1.3250. Stronger support is at the 1.3215 Fibonacci retracement. But already oversold daily stochastics should limit any initial tests in consolidation, before deteriorating longer-term charts prompt any further losses. Meanwhile, resistance remains up to congestion around 1.3400. A close back above here, if seen, would help to stabilise price action and prompt consolidation beneath strong resistance at congestion around 1.3450 and the 1.3465 Fibonacci retracement.