Chart USD/ZAR Update: Short-term consolidation before April losses resume
Anticipated losses have reached 16.3000~, where flat oversold daily stochastics are prompting consolidation
| Level | Comment | Level | Comment | |||||
|---|---|---|---|---|---|---|---|---|
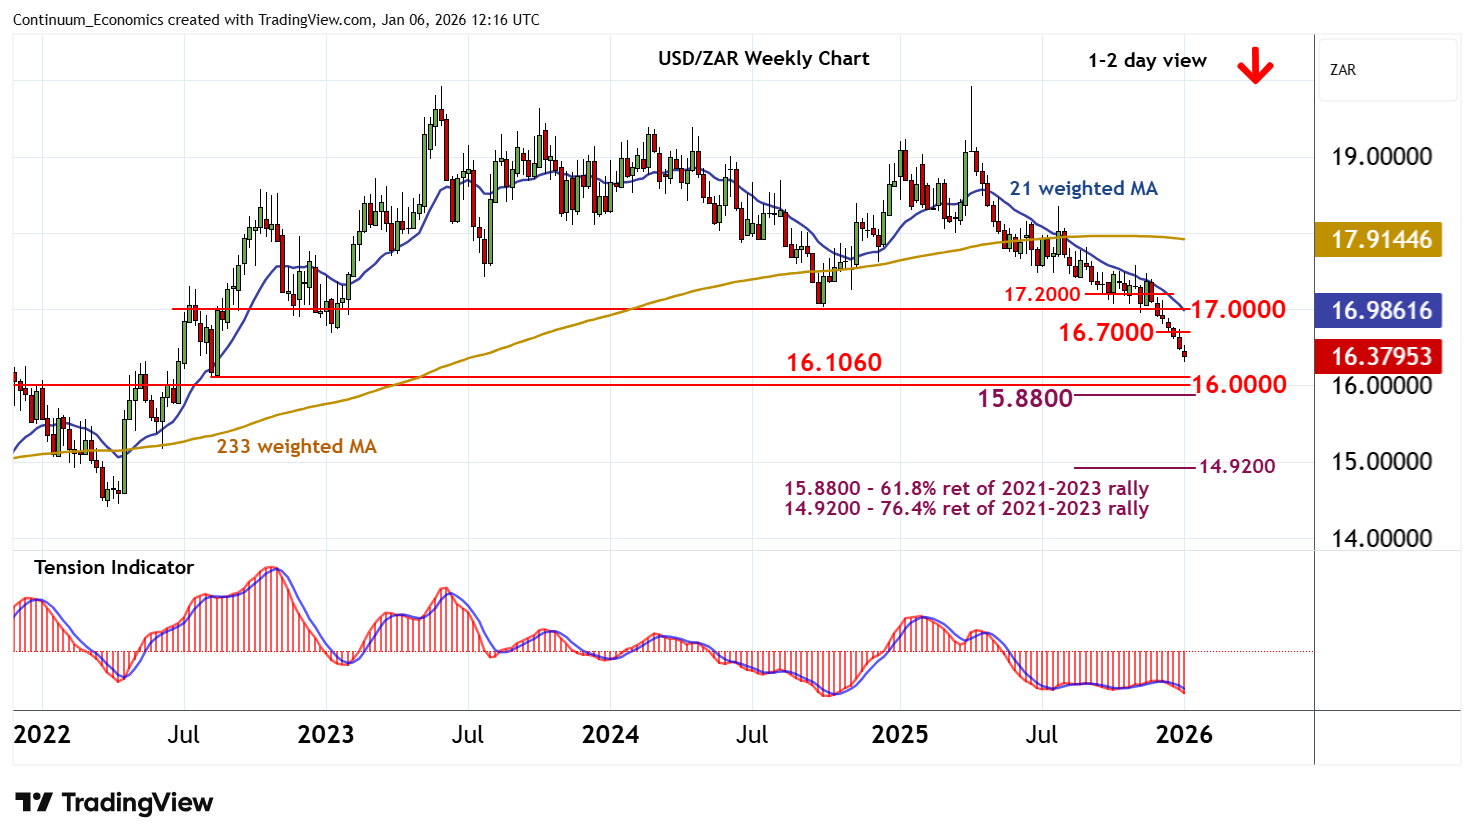
| R4 | 17.2000 | * | congestion | S1 | 16.3000~ | intraday low | ||
| R3 | 17.0000 | ** | congestion | S2 | 16.1060 | ** | 11 Aug 2022 (m) low | |
| R2 | 16.8000 | break level | S3 | 16.0000 | ** | congestion | ||
| R1 | 16.7000 | break level | S4 | 15.8800 | ** | 61.8% ret of 2021-2023 rally |
Asterisk denotes strength of level
12:00 GMT - Anticipated losses have reached 16.3000~, where flat oversold daily stochastics are prompting consolidation. The daily Tension Indicator continues to track lower, however, and broader weekly charts are bearish, suggesting any immediate gains should be limited in renewed selling interest. Resistance remains at the 16.7000 break level. An unexpected close above here would help to stabilise price action and delay downside development, as prices settle into consolidation beneath 17.0000. Following cautious trade, fresh losses are looked for, with the April bear trend to focus on the 16.1060 monthly low of 11 August 2022 and historic congestion around 16.0000. Just lower is the 15.8800 Fibonacci retracement. But flat oversold weekly stochastics are expected to limit any initial tests of this broad 15.8800 - 16.1060 range in short-covering/consolidation.