Published: 2026-04-06T00:45:26.000Z
Chart NZD/USD Update: Extending January losses
-
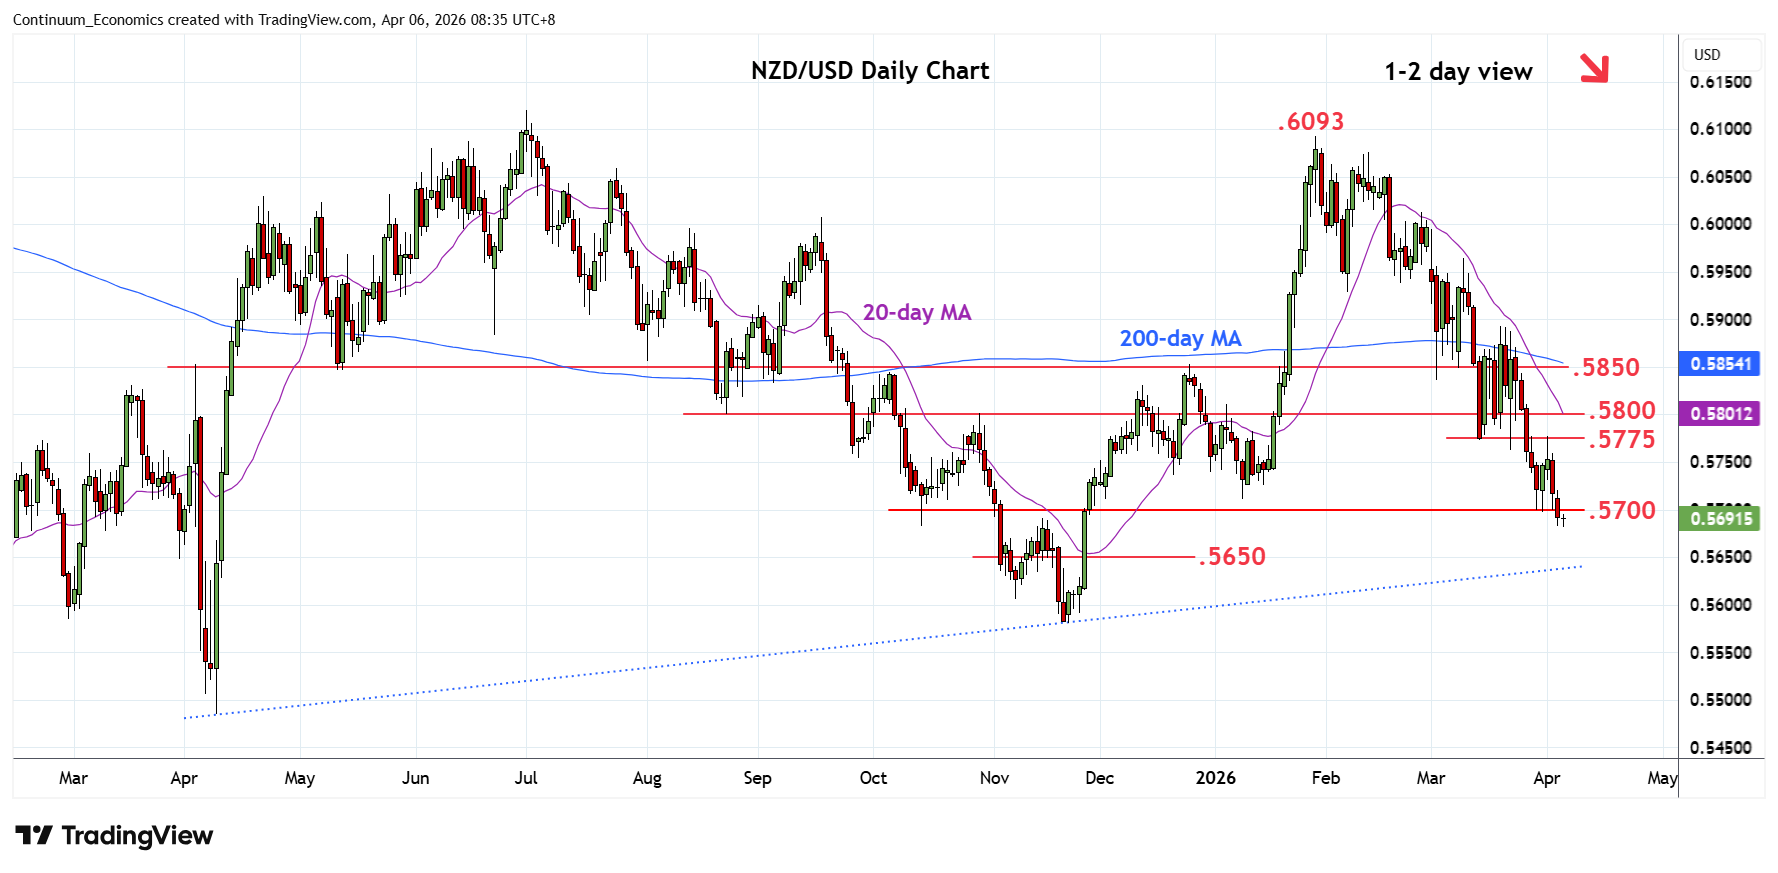
Under pressure as break of the .5700 level see prices extending losses from the .6093, January current year high
| Levels | Imp | Comment | Levels | Imp | Comment | |||
|---|---|---|---|---|---|---|---|---|
| R4 | .5850 | ** | congestion | S1 | .5650 | * | congestion | |
| R3 | .5800 | * | congestion | S2 | .5640 | * | trendline | |
| R2 | .5775 | * | 13 Mar low | S3 | .5606 | * | 7 Nov low | |
| R1 | .5750 | * | congestion | S4 | .5578 | ** | 21 Nov low |
Asterisk denotes strength of level
00:40 GMT - Under pressure as break of the .5700 level see prices extending losses from the .6093, January current year high. Below the .5680 low will see room for extension to support at the .5650/40, congestion and trendline from the April 2025 year low. Break here, if seen, will return focus to the .5600/.5578 congestion and November low. Meanwhile, resistance is lowered to the .5750/.5775 congestion and low of 13 March. Regaining this will ease the downside pressure and see room for stronger gains to resistance at the .5800/.5850 area.