Chart USD/CAD Update: Fresh 2025 year low

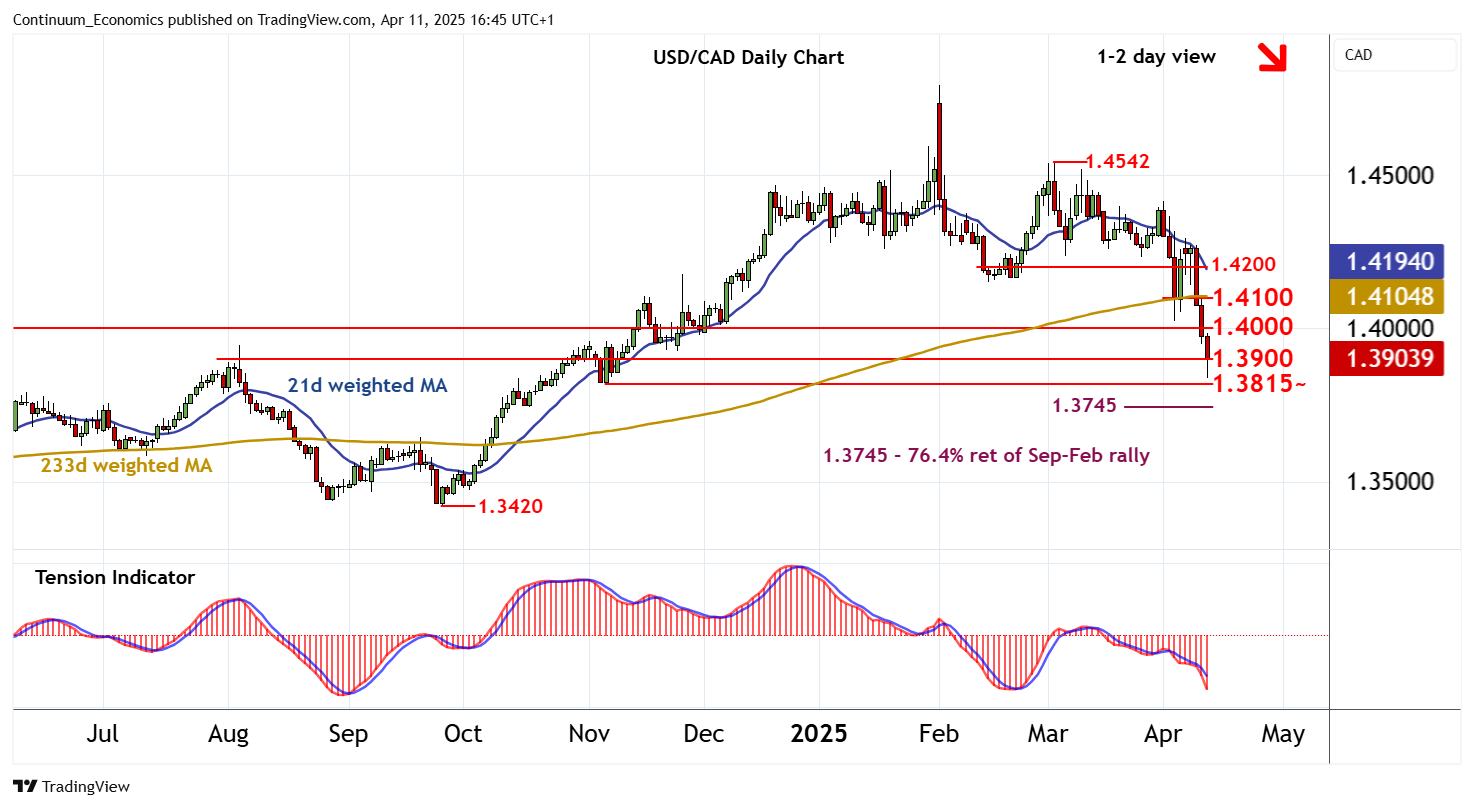
Anticipated losses have posted a fresh 2025 year low at 1.3840
| Levels | Imp | Comment | Levels | Imp | Comment | |||
|---|---|---|---|---|---|---|---|---|
| R4 | 1.4300 | * | break level | S1 | 1.3900 | * | congestion | |
| R3 | 1.4200 | congestion | S2 | 1.3840~ | current YTD low | |||
| R2 | 1.4100 | break level | S3 | 1.3815 | ** | 6 Nov (m) low | ||
| R1 | 1.4000 | * | break level | S4 | 1.3745 | ** | 76.4% ret of Sep-Feb rally |
Asterisk denotes strength of level
16:20 BST - Anticipated losses have posted a fresh 2025 year low at 1.3840, where unwinding oversold intraday studies are prompting short-term reactions and bounce back to 1.3900. Daily readings continue to track lower and longer-term charts are also bearish, highlighting room for still further losses in the coming sessions. A break back below 1.3900 will add weight to sentiment and extend February losses towards the 1.3815 monthly low of 6 November. Beneath here is the 1.3745 Fibonacci retracement, but already oversold daily and weekly stochastics could limit any initial tests in consolidation. Meanwhile, resistance is lowered to 1.4000. A close above here, if seen, will help to stabilise price action and prompt consolidation beneath 1.4100.