Published: 2026-04-22T07:47:55.000Z
Chart EUR/USD Update: Consolidating losses - studies under pressure
1
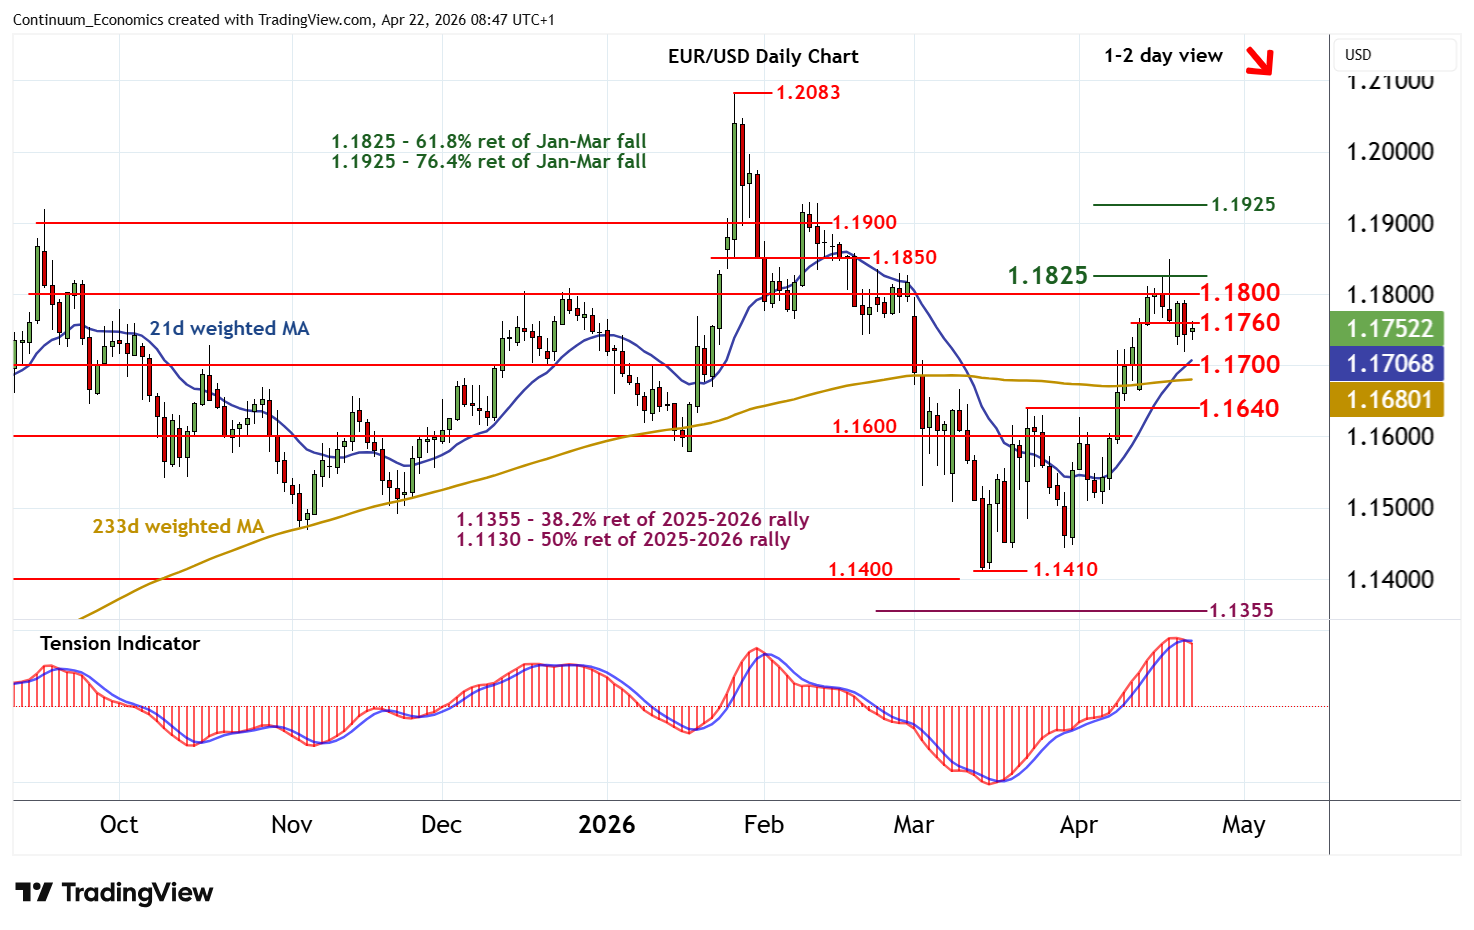
Anticipated selling interest has reached 1.1720~
| Levels | Imp | Comment | Levels | Imp | Comment | |||
|---|---|---|---|---|---|---|---|---|
| R4 | 1.1850 | break level | S1 | 1.1720~ | 21 Apr low | |||
| R3 | 1.1825 | ** | 61.8% ret of Jan-Mar fall | S2 | 1.1700 | ** | congestion | |
| R2 | 1.1800 | ** | congestion | S3 | 1.1640 | ** | 23 Mar (w) high | |
| R1 | 1.1760 | break level | S4 | 1.1600 | ** | congestion |
*Asterisk denotes strength of level
08:30 BST - Anticipated selling interest has reached 1.1720~. Flat intraday studies are prompting a bounce to resistance at 1.1760, but negative daily stochastics and a tick lower in the daily Tension Indicator should limit any break in renewed selling interest beneath congestion around 1.1800. Following cautious trade, fresh losses are looked for. A break below 1.1720~ will open up congestion around 1.1700. However, rising weekly charts should limit any deeper losses in buying interest/consolidation towards the 1.1640 weekly high of 23 March.