Published: 2026-04-17T06:48:40.000Z
Chart AUD/NZD Update: Within reach of 1.2200 current year high
2
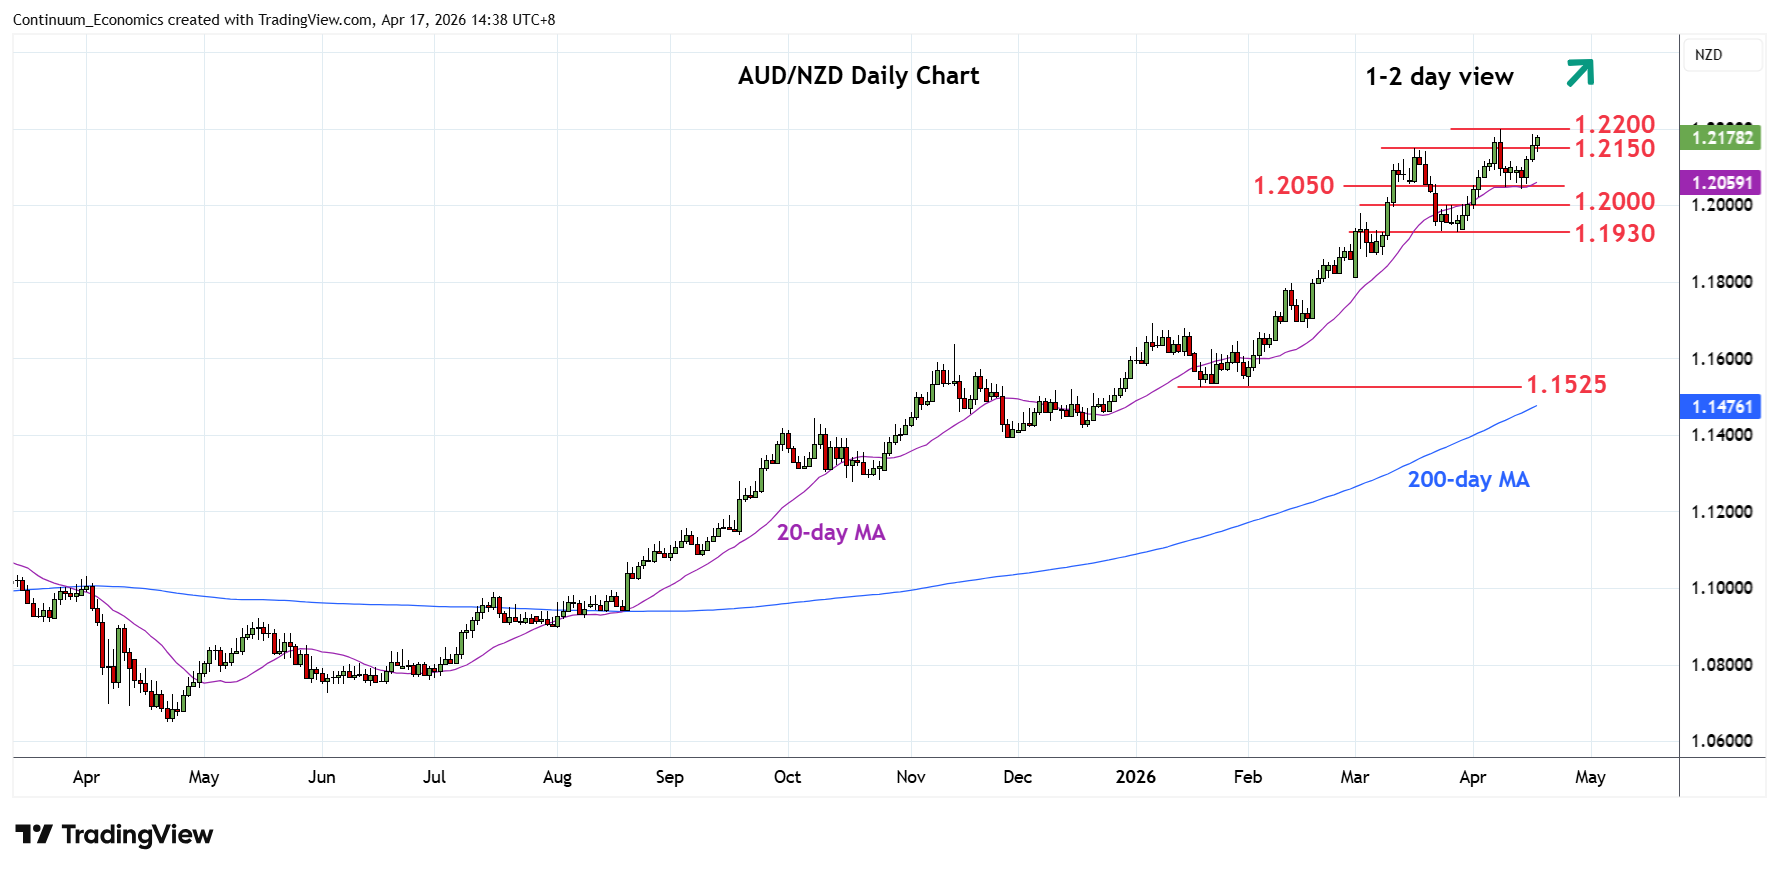
Extending bounce from support at the 1.2050 congestion to expose the 8 April current year high at the 1.2200 level to retest
| Level | Comment | Level | Comment | |||||
|---|---|---|---|---|---|---|---|---|
| R4 | 1.2400 | * | congestion | S1 | 1.2100/50 | ** | congestion | |
| R3 | 1.2350 | * | 61.8% 2011/2020 fall | S2 | 1.2000 | * | figure, congestion | |
| R2 | 1.2300/10 | ** | congestion, 2011 yr low | S3 | 1.1930 | ** | 27 Mar low | |
| R1 | 1.2200 | ** | 8 Apr YTD high | S4 | 1.1860 | 4 Mar low |
Asterisk denotes strength of level
06:50 GMT - Extending bounce from support at the 1.2050 congestion and break above the 1.2150 resistance expose the 8 April current year high at the 1.2200 level to retest. Break here will further extend the bullish gains from the April 2025 low and see room for extension to resistance at the 1.2300/10 congestion and 1.2350, 61.8% Fibonacci retracement. Meanwhile, support at the 1.2100/1.2050 congestion area should underpin. Only below here will ease the upside pressure and open up room for deeper corrective pullback to support at the 1.2000 figure and 1.1930, 27 March swing low.