Chart USD/ZAR Update: Cautious trade - studies under pressure
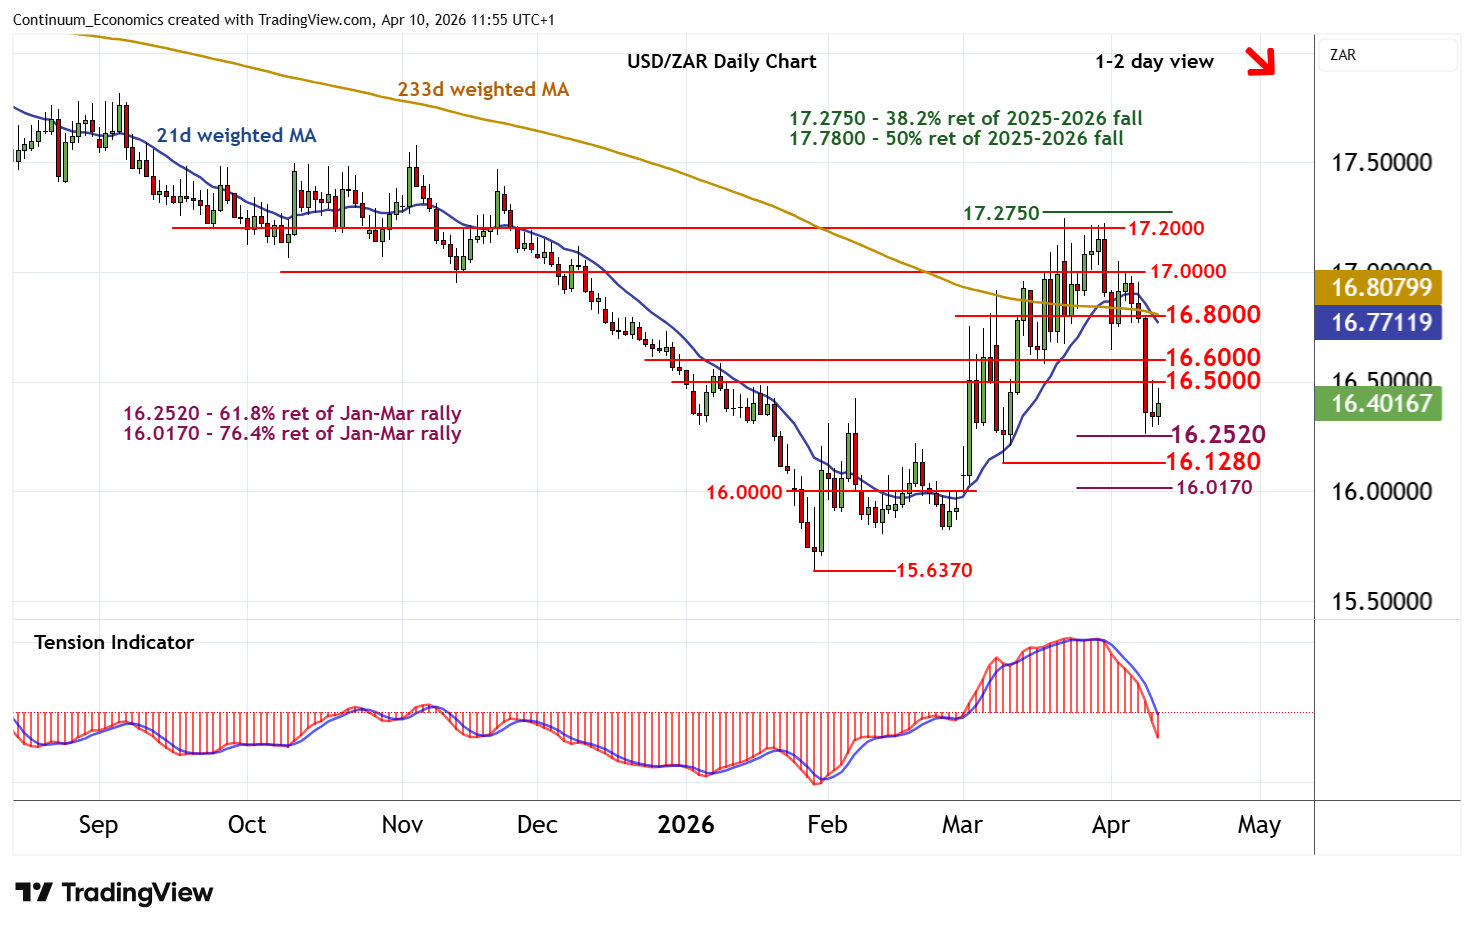
Little change, as prices extend cautious/choppy trade beneath resistance at the 16.5000 break level
| Level | Comment | Level | Comment | |||||
|---|---|---|---|---|---|---|---|---|
| R4 | 17.0000 | * | congestion | S1 | 16.2520 | ** | 61.8% ret of Jan-Mar rally | |
| R3 | 16.8000 | congestion | S2 | 16.1280 | * | 10 Mar (w) low | ||
| R2 | 16.6000 | break level | S3 | 16.0170 | ** | 76.4% ret of Jan-Mar rally | ||
| R1 | 16.5000 | break level | S4 | 16.0000 | ** | congestion |
Asterisk denotes strength of level
11:45 BST - Little change, as prices extend cautious/choppy trade beneath resistance at the 16.5000 break level. Intraday studies continue to rise, highlighting potential for a test above here. But negative daily readings and unwinding overbought weekly stochastics should limit scope in renewed selling interest towards 16.6000. Following corrective trade, fresh losses are looked for. Support is at the 16.2520 Fibonacci retracement. A later break beneath here will add weight to sentiment and extend late-March losses towards the 16.1280 weekly low of 10 March. However, the rising weekly Tension Indicator and improving longer-term charts should limit any deeper losses in short-covering/consolidation above strong support within the 16.0000 - 16.0170 range.