Published: 2025-11-04T00:57:56.000Z
Chart USD/JPY Update: Pressuring 154.40/45 highs
2
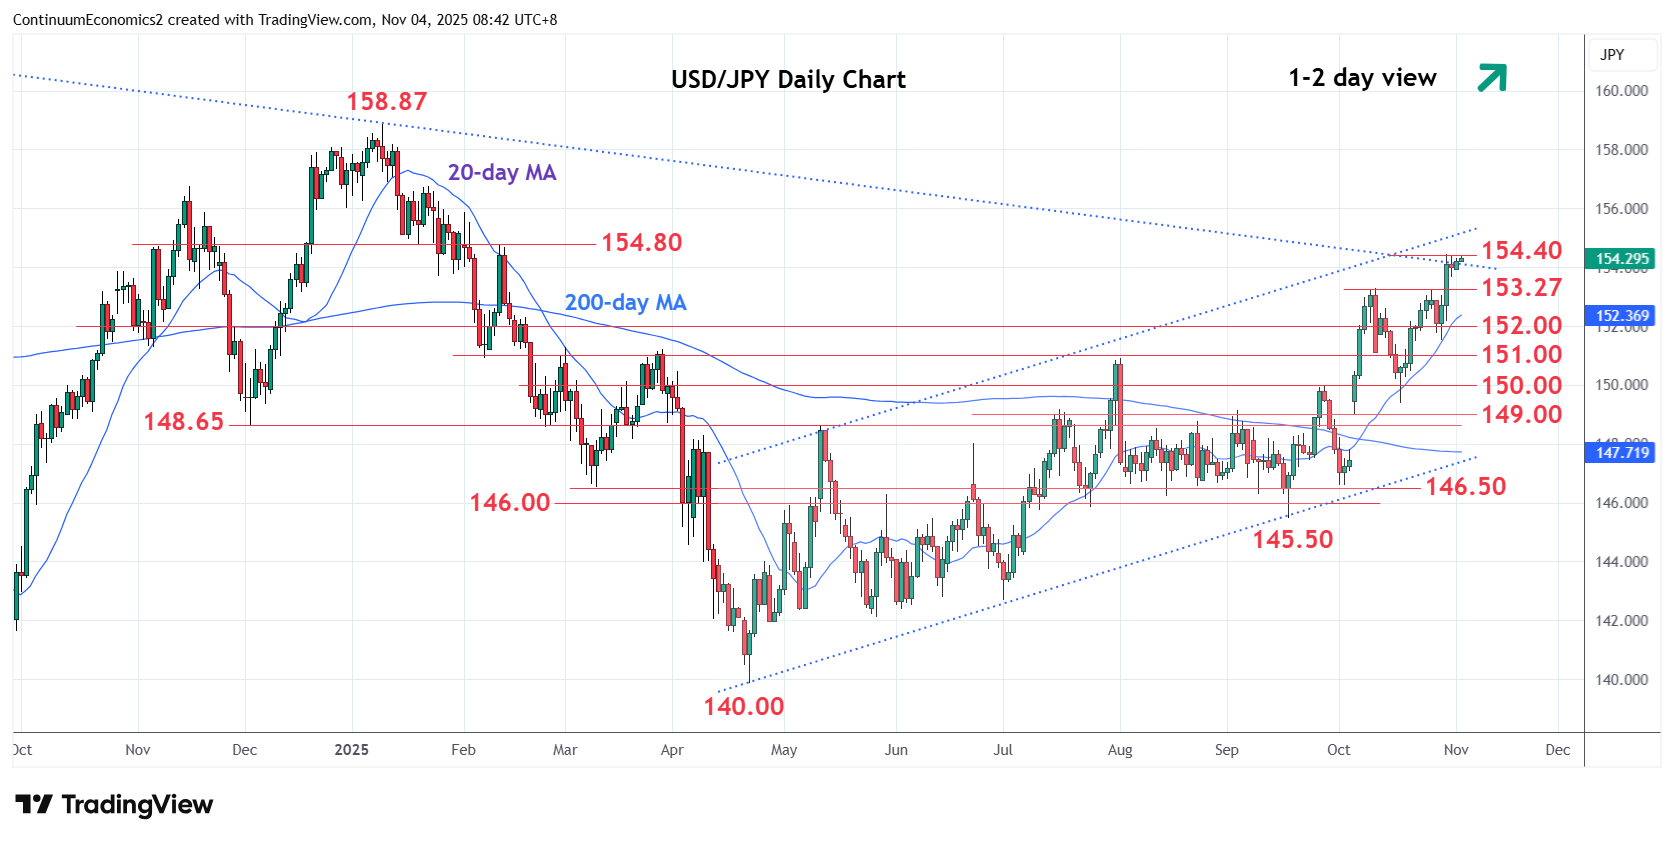
Still little change, as prices extend consolidation below the 154.40/154.45, 76.4% Fibonacci level and high of last week
| Levels | Imp | Comment | Levels | Imp | Comment | |||
|---|---|---|---|---|---|---|---|---|
| R4 | 156.00 | * | congestion | S1 | 153.27/00 | ** | 10 Oct high, congestion | |
| R3 | 155.00 | * | congestion | S2 | 152.00 | * | congestion | |
| R2 | 154.80 | * | 12 Feb high | S3 | 151.50 | * | congestion | |
| R1 | 154.40/45 | ** | 76.4%, 30 Oct high | S4 | 150.92 | ** | Aug high |
Asterisk denotes strength of level
00:50 GMT - Still little change, as prices extend consolidation below the 154.40/154.45, 76.4% Fibonacci level and high of last week. However, pressure remains on the upside and see room to further extend gains within the bull channel from the 140.00 April current year low. Higher will see scope for extension to resistance at the 154.80/155.00 area though overbought daily studies caution corrective pullback. Would take break of support at the 153.27/153.00 area to open up room for pullback to retrace strong gains from the 145.50, September low.