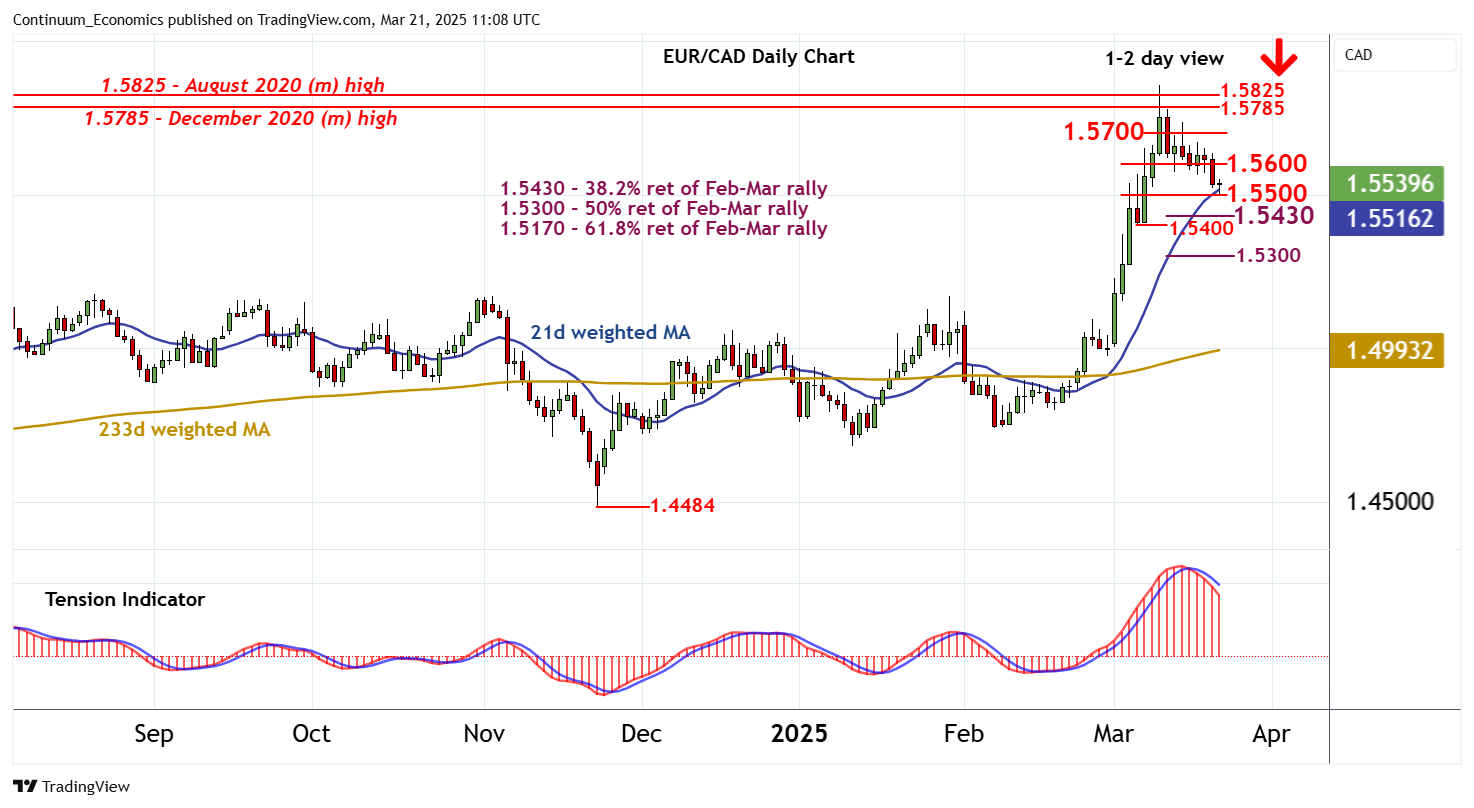
Chart EUR/CAD Update: Room for lower

Anticipated losses have reached congestion support at 1.5500

| Level | Comment | Level | Comment | |||||
|---|---|---|---|---|---|---|---|---|
| R4 | 1.5825 | ** | August 2020 (m) high | S1 | 1.5500 | ** | congestion | |
| R3 | 1.5785 | ** | December 2020 (m) high | S2 | 1.5430 | * | 38.2% ret of Feb-Mar rally | |
| R2 | 1.5700 | break level | S3 | 1.5400 | * | congestion | ||
| R1 | 1.5600 | * | congestion | S4 | 1.5300 | * | 50% ret of Feb-Mar rally |
Asterisk denotes strength
10:50 GMT - Anticipated losses have reached congestion support at 1.5500, where rising oversold intraday studies are prompting a minor bounce to 1.5530. Daily readings continue to track lower and overbought weekly stochastics are showing early signs of flattening, suggesting room for still further losses in the coming sessions. A break beneath here will open up the 1.5430 Fibonacci retracement, with further losses adding weight to sentiment and signalling a deeper correction of the broad gains from November 2024. Subsequent focus will then turn down to the 1.5300 retracement. Meanwhile, a close above congestion resistance at 1.5600 would turn sentiment neutral and prompt consolidation beneath 1.5700.